DUET 2021 Question Paper M.Phil Ph.D in Business Economics
Finished viewing? Save it for later —
Download DUET 2021 Question Paper M.Phil Ph.D in Business Economics (PDF · 11 pages)About DUET 2021 Question Paper M.Phil Ph.D in Business Economics
DUET 2021 Question Paper M.Phil Ph.D in Business Economics is available here for free download. Published by NTA for DUET, this question paper can be viewed online or downloaded as a PDF (11 pages). Candidates preparing for DUET can use DUET 2021 Question Paper M.Phil Ph.D in Business Economics to understand the exam pattern, the type of questions asked, and the overall difficulty level.
Frequently Asked Questions
How can I download DUET 2021 Question Paper M.Phil Ph.D in Business Economics?
Open this page and click the Download button to save DUET 2021 Question Paper M.Phil Ph.D in Business Economics as a PDF. It is completely free on AglaSem Docs.
Is DUET 2021 Question Paper M.Phil Ph.D in Business Economics free to download?
Yes. DUET 2021 Question Paper M.Phil Ph.D in Business Economics can be viewed online and downloaded as a PDF free of cost on AglaSem Docs.
How many pages does DUET 2021 Question Paper M.Phil Ph.D in Business Economics have?
DUET 2021 Question Paper M.Phil Ph.D in Business Economics contains 11 pages, which you can read online or download together as a single PDF.
Where can I find more DUET study material?
You can find more DUET question papers, sample papers, syllabus, and answer keys on AglaSem Docs.
DUET 2021 Question Paper M.Phil Ph.D in Business Economics – Text
Read the full text of this question paper below — useful to quickly search, copy and reference the content online without downloading the PDF.
📄 View text version (11 pages)
Page 1
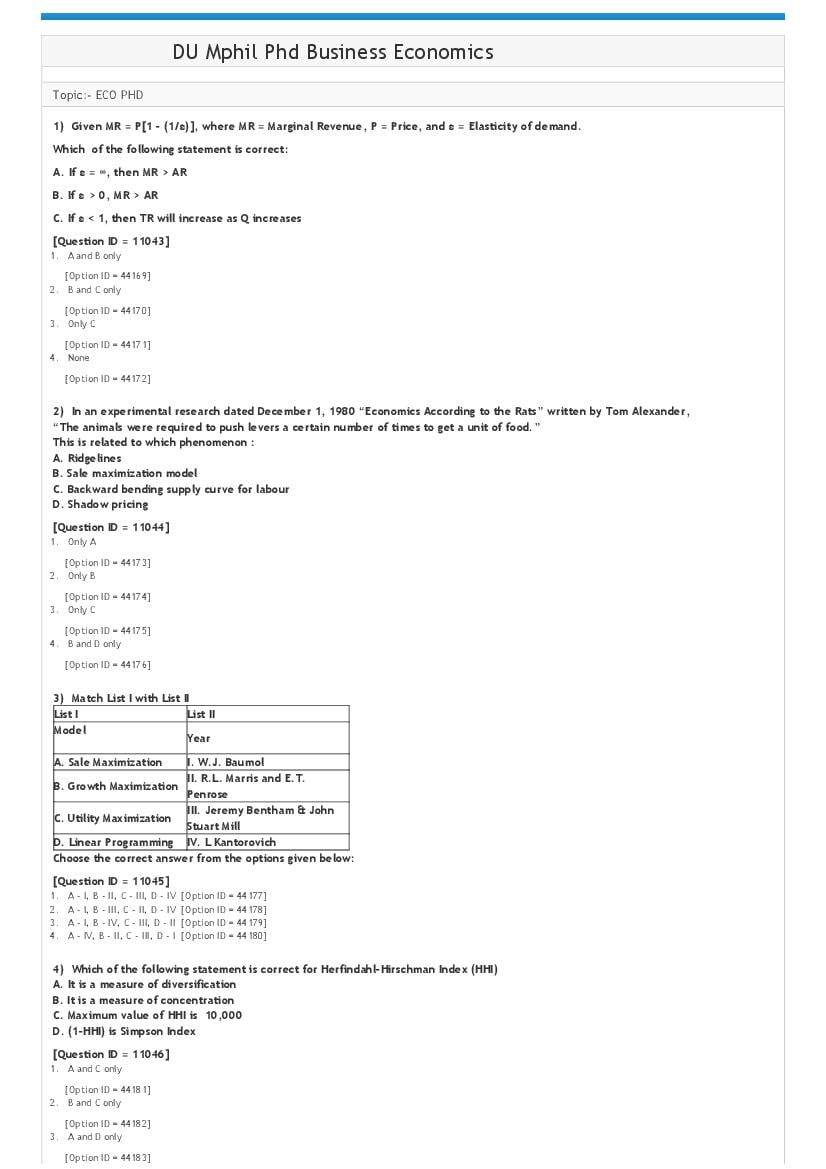
Topic:‐ ECO PHD
1) Given MR = P[1 ‐ (1/ε)], where MR = Marginal Revenue, P = Price, and ε = Elasticity of demand.
Which of the following statement is correct:
A. If ε = ∞, then MR > AR
B. If ε > 0, MR > AR
C. If ε < 1, then TR will increase as Q increases
[Question ID = 11043]
1. A and B only
[Option ID = 44169]
2. B and C only
[Option ID = 44170]
3. Only C
[Option ID = 44171]
4. None
[Option ID = 44172]
2) In an experimental research dated December 1, 1980 “Economics According to the Rats” written by Tom Alexander,
“The animals were required to push levers a certain number of times to get a unit of food.”
This is related to which phenomenon :
A. Ridgelines
B. Sale maximization model
C. Backward bending supply curve for labour
D. Shadow pricing
[Question ID = 11044]
1. Only A
[Option ID = 44173]
2. Only B
[Option ID = 44174]
3. Only C
[Option ID = 44175]
4. B and D only
[Option ID = 44176]
3) Match List I with List II
List I List II
Model
Year
A. Sale Maximization I. W.J. Baumol
II. R.L. Marris and E.T.
B. Growth Maximization
Penrose
III. Jeremy Bentham & John
C. Utility Maximization
Stuart Mill
D. Linear Programming IV. L Kantorovich
Choose the correct answer from the options given below:
[Question ID = 11045]
1. A ‐ I, B ‐ II, C ‐ III, D ‐ IV [Option ID = 44177]
2. A ‐ I, B ‐ III, C ‐ II, D ‐ IV [Option ID = 44178]
3. A ‐ I, B ‐ IV, C ‐ III, D ‐ II [Option ID = 44179]
4. A ‐ IV, B ‐ II, C ‐ III, D ‐ I [Option ID = 44180]
4) Which of the following statement is correct for Herfindahl‐Hirschman Index (HHI)
A. It is a measure of diversification
B. It is a measure of concentration
C. Maximum value of HHI is 10,000
D. (1‐HHI) is Simpson Index
[Question ID = 11046]
1. A and C only
[Option ID = 44181]
2. B and C only
[Option ID = 44182]
3. A and D only
[Option ID = 44183]
Page 2
[Option ID = 44184]
5) Which of the following statements are true:
A. Two independent variables are uncorrelated
B. Two variables are uncorrelated, need not necessarily be Independent
[Question ID = 11048]
1. Only A
[Option ID = 44189]
2. Only B
[Option ID = 44190]
3. A and B both
[Option ID = 44191]
4. None
[Option ID = 44192]
6) Which of the following statements are false:
A. In long‐run output is determined by aggregate supply alone
B. In long‐run prices are determined by aggregate demand alone
C. In short‐run output is determined by aggregate demand alone
D. In short‐run prices are determined by both aggregate demand and aggregate supply
[Question ID = 11049]
1. A and D only
[Option ID = 44193]
2. A and C only
[Option ID = 44194]
3. B and D only
[Option ID = 44195]
4. B and C only
[Option ID = 44196]
7) Which of the following is correct about the Kinked Demand curve
A. It was propagated by the P.Sweezy in his seminal work
B. There is a gap in the marginal revenue curve
C. The gap in the marginal revenue curve depends on the elasticity of the market demand curve and individual demand curve.
Which of the above is /are true?
[Question ID = 11050]
1. A and B only
[Option ID = 44197]
2. B and C only
[Option ID = 44198]
3. A and C only
[Option ID = 44199]
4. A, B and C
[Option ID = 44200]
8) Consider the following
A. The range of elasticity of demand is 0 < ep < 1
B. The cross elasticity of demand is negative for the substitute goods and positive for the complementary goods.
C. The elasticity at the midpoint of a linear demand curve is zero.
D. The elasticity of income for the necessity good is positive but less than one, but for the luxury goods it is greater than one whereas
for the inferior goods it is negative.
Which of the above is/are incorrect?
[Question ID = 11051]
1. Only C
[Option ID = 44201]
2. B and C only
[Option ID = 44202]
3. A and B only
[Option ID = 44203]
4. A, B and C only
[Option ID = 44204]
9) What is Bennett’s law of food consumption?[Question ID = 11052]
1. It states that as growth takes place the subsistence agriculture is replaced by commercial agriculture. [Option ID = 44205]
2. It states the chronological development of agriculture followed by manufacture ultimately followed by the services. [Option ID = 44206]
3. It states the mechanization of agriculture as the economy develops. [Option ID = 44207]
4. It states that with rising incomes people consume relatively less “starchy staples” and shift to more nutritious food with proteins and vitamins. [Option ID =
44208]
Page 3
1. Per capita income [Option ID = 44209]
2. Literacy rate [Option ID = 44210]
3. Life expectancy [Option ID = 44211]
4. Infant mortality rate [Option ID = 44212]
11) The multidimensional poverty index prepared by the United Nation’s Development Report consists of three dimensions and they
are
A. Health
B. Education
C. Living standards
D. Sustainability
Which of the above is/are correct?
[Question ID = 11054]
1. A and B only
[Option ID = 44213]
2. B and C only
[Option ID = 44214]
3. A and D only
[Option ID = 44215]
4. A, B and C only
[Option ID = 44216]
12) In the market for taxis, the government regulation that every taxi driver owns a medallion is a restriction on trade. This results in a
change to social welfare in the medallion market. How can you describe that change?[Question ID = 11055]
1. A decrease in deadweight loss. [Option ID = 44217]
2. An increase in deadweight loss, and a transfer of surplus from consumers to producers. [Option ID = 44218]
3. A transfer of surplus from consumers to producers. [Option ID = 44219]
4. An increase in deadweight loss, and a transfer of surplus from producers to consumers. [Option ID = 44220]
13) Suppose that investment (I) in the goods market is not responsive to the interest rate (that is, I does not depend on the interest
rate at all). Then
[Question ID = 11056]
1. The IS curve is a vertical line and monetary policy is very effective in raising output.
[Option ID = 44221]
2. The IS curve is a horizontal line and monetary policy is very effective in raising output.
[Option ID = 44222]
3. The IS curve is a vertical line and monetary policy does not affect output in the IS‐LM model.
[Option ID = 44223]
4. The IS curve is a horizontal line and monetary policy does not affect output in the IS‐LM model.
[Option ID = 44224]
14) You observe that the domestic interest rate increases from 5% to 15%, and you are in a fixed exchange rate system, then this
implies that:[Question ID = 11057]
1. The level of the international interest rate increased by 5% [Option ID = 44225]
2. Agents are expecting a nominal appreciation of 5% [Option ID = 44226]
3. Agents are expecting a nominal depreciation of 5% [Option ID = 44227]
4. Both 1 and 3 [Option ID = 44228]
15) If the demand curves for a monopolist’s commodity are identical in two separate markets, then, by practicing third‐degree price
discrimination, the monopolist[Question ID = 11058]
1. will increase TR and total profits [Option ID = 44229]
2. can increase TR and total profits [Option ID = 44230]
3. cannot increase TR and total profits, or [Option ID = 44231]
4. will charge a different price in different markets. [Option ID = 44232]
16) The Lerner index for a firm increases when[Question ID = 11059]
1. the number of substitutes for the firm’s product increases [Option ID = 44233]
2. better substitutes for the firm’s product are introduced [Option ID = 44234]
3. more competitors enter the market [Option ID = 44235]
4. the price elasticity of demand for the firm’s product decreases. [Option ID = 44236]
17) If the income effect dominates the substitution effect in the labor supply decision, what happens when the wage increases?
[Question ID = 11060]
1. It depends on their specific preferences. [Option ID = 44237]
2. Workers work more. [Option ID = 44238]
3. Workers work less. [Option ID = 44239]
4. Workers work the same amount. [Option ID = 44240]
18) “Factor substitution possibilities render the problem of natural resource scarcity to be manageable, but not necessarily irrelevant.”
This statement implies:[Question ID = 11065]
1. The natural resource scarcity problem is manageable. [Option ID = 44257]
2. The natural resource scarcity problem is not necessarily irrelevant. [Option ID = 44258]
3. By using different factors of production the problem of natural resource scarcity can be managed but can’t be made irrelevant. [Option ID = 44259]
Page 4
19) “Waste Emission should not exceed the renewable assimilative capacity of the environment.”
For the above statement, which of the following is true?
A. The environment has a capacity to absorb waste.
B. Waste emission typically exceeds the assimilative capacity of the environment.
C. The assimilative capacity of the environment is renewable.
D. All of the above
[Question ID = 11066]
1. Only D
[Option ID = 44261]
2. Only B
[Option ID = 44262]
3. A and C only
[Option ID = 44263]
4. A and B only
[Option ID = 44264]
20) “Double counting is a potentially serious problem often encountered in assessing both social and private projects.”
For the above statement, which of the following is true?
A. Double counting is a serious problem in assessing social projects.
B. Double counting is a serious problem in assessing private projects.
C. Double counting could be related to costs.
D. Double counting could be related to benefits.
[Question ID = 11067]
1. A and B only
[Option ID = 44265]
2. C and D only
[Option ID = 44266]
3. None of the above
[Option ID = 44267]
4. All of the above
[Option ID = 44268]
21) Which of the following cannot be used to calculate average of the data, when data contains an observation equal to zero?
A. Harmonic Mean
B. Geometric Mean
C. Arithmetic Mean
D. Weighted Mean
[Question ID = 11071]
1. A and C only
[Option ID = 44281]
2. B and D only
[Option ID = 44282]
3. A and B only
[Option ID = 44283]
4. B and C only
[Option ID = 44284]
22) Which statement is correct?
A. Simultaneous minimising of Type I and Type II error is possible
B. Level of significance is the size of the critical region
C. Power of the test is the probability of rejecting null hypothesis when alternative hypothesis is true
D. Smaller the P‐value, smaller is the significance.
[Question ID = 11072]
1. A and D only
[Option ID = 44285]
2. A and C only
[Option ID = 44286]
3. B and C only
[Option ID = 44287]
4. C and D only
[Option ID = 44288]
23) The sum of squared deviations of n values from their mean is[Question ID = 11074]
1. Maximum [Option ID = 44293]
2. Least [Option ID = 44294]
3. 0 [Option ID = 44295]
4. None [Option ID = 44296]
Page 5
1. Systematic Sampling [Option ID = 44297]
2. Cluster Sampling [Option ID = 44298]
3. Quota Sampling [Option ID = 44299]
4. Stratified Sampling [Option ID = 44300]
25) “The mean of a binomial distribution is 6 and variance is 1.8”, this statement is[Question ID = 11077]
1. Correct [Option ID = 44305]
2. Wrong [Option ID = 44306]
3. Can’t Say [Option ID = 44307]
4. Data Inadequate [Option ID = 44308]
26) Which of the following statements is incorrect?
A. If one of the regression coefficients is greater than unity, then the other must be less than unity.
B. Arithmetic mean of the regression coefficients is greater than the correlation coefficient.
C. Regression coefficient is independent of the change in both origin and scale.
[Question ID = 11078]
1. Only A
[Option ID = 44309]
2. A and B only
[Option ID = 44310]
3. A and C only
[Option ID = 44311]
4. A, B and C
[Option ID = 44312]
27) The sum of absolute deviation about median will be :[Question ID = 11081]
1. Greatest [Option ID = 44321]
2. Least [Option ID = 44322]
3. Zero [Option ID = 44323]
4. Equal [Option ID = 44324]
28) Which of the following statements are true:
A. We reject the null hypothesis if P value is greater than the level of significance.
B. We do not reject the null hypothesis if P value is greater than the level of significance.
C. P value is the lowest level of significance at which we can reject the null hypothesis.
[Question ID = 11083]
1. A, B and C
[Option ID = 44329]
2. Only A
[Option ID = 44330]
3. A and C only
[Option ID = 44331]
4. B and C only
[Option ID = 44332]
29) Which of the following statement/s are true
A. Unbiased estimator is always an efficient estimator
B. An efficient estimator has maximum variance in the class of all unbiased estimators
[Question ID = 11085]
1. A and B
[Option ID = 44337]
2. Only A
[Option ID = 44338]
3. Only B
[Option ID = 44339]
4. None
[Option ID = 44340]
30) If you have the following data
Dependent variable Independent variables
Y X1 X2
60 2 10
80 3 15
100 8 40
120 4 20
140 10 50
You regress Y on X1 and X2 using ordinary least square method (OLS) then
[Question ID = 11086]
Page 6
2. Confidence interval will be very small [Option ID = 44342]
3. Both 1 and 2 [Option ID = 44343]
4. Standard errors of the estimators will be infinity [Option ID = 44344]
31) The best method to find the seasonal variation is[Question ID = 11087]
1. Ratio to trend method [Option ID = 44345]
2. Ratio to moving average method [Option ID = 44346]
3. Simple average method [Option ID = 44347]
4. None [Option ID = 44348]
32) Which of the following measure of central tendency can be used for qualitative data?
A. Arithmetic Mean
B. Weighted Mean
C. Median
D. Mode
[Question ID = 11090]
1. Only A
[Option ID = 44357]
2. A and B only
[Option ID = 44358]
3. Only C
[Option ID = 44359]
4. Only D
[Option ID = 44360]
33) In this question a statement is given followed by two conclusions numbered I and II. You have to assume everything in the
statement to be true, then consider the two conclusions together and decide which of them logically follows beyond a reasonable doubt
from the information given in the statement.
Statement: OLS (Ordinary least square) method is used to estimate the model with heteroscedasticity
Conclusions:
I. Estimators will inefficient
II. Estimators will be unbiased
[Question ID = 11091]
1. Only conclusion I follows
[Option ID = 44361]
2. Only conclusion II follows
[Option ID = 44362]
3. Both I and II follows
[Option ID = 44363]
4. Neither I nor II follows
[Option ID = 44364]
34) In this question a statement is given followed by two conclusions numbered I and II. You have to assume everything in the
statement to be true, then consider the two conclusions together and decide which of them logically follows beyond a reasonable doubt
from the information given in the statement.
Statement: A distribution is skewed
Conclusions:
I. Quartiles are equidistance from the median.
II. Mean ≠ Median ≠ Mode
[Question ID = 11092]
1. Only conclusion I follows
[Option ID = 44365]
2. Only conclusion II follows
[Option ID = 44366]
3. Both I and II follows
[Option ID = 44367]
4. Neither I nor II follows
[Option ID = 44368]
35) The following pie‐chart shows the percentage distribution of the expenditure incurred in publishing a Journal. Study the pie‐chart
and answer the questions based on it.
Page 7
used in a single copy of the journal?
[Question ID = 11098]
1. Rs.35
[Option ID = 44389]
2. Rs.26
[Option ID = 44390]
3. Rs.50
[Option ID = 44391]
4. Rs.55.25
[Option ID = 44392]
36) The following pie‐chart shows the percentage distribution of the expenditure incurred in publishing a Journal. Study the pie‐chart
and answer the questions based on it.
If 11000 copies are published and the transportation cost on them amounts to Rs. 1,65,000, then what should be the selling price of
the journal so that the publisher can earn a profit of 25%?[Question ID = 11099]
1. Rs.187.50 [Option ID = 44393]
2. Rs.191.50 [Option ID = 44394]
3. Rs.185 [Option ID = 44395]
4. Rs.180 [Option ID = 44396]
37) The following pie‐chart shows the percentage distribution of the expenditure incurred in publishing a Journal. Study the pie‐chart
and answer the questions based on it.
Royalty on the journal is less than the printing cost by:
[Question ID = 11100]
1. 5%
[Option ID = 44397]
2.
[Option ID = 44398]
3. 22%
[Option ID = 44399]
4. 25%
Page 8
38)
[Question ID = 11101]
1.
[Option ID = 44401]
2.
[Option ID = 44402]
3.
[Option ID = 44403]
4.
[Option ID = 44404]
39) If C and D are two sets the value of
is[Question ID = 11102]
1.
[Option ID = 44405]
2.
[Option ID = 44406]
3.
[Option ID = 44407]
4.
[Option ID = 44408]
40)
[Question ID = 11103]
1.
[Option ID = 44409]
2.
[Option ID = 44410]
3.
[Option ID = 44411]
4.
[Option ID = 44412]
41) In the following model
the elasticity of Y with respect to X is
[Question ID = 11104]
1.
[Option ID = 44413]
2.
[Option ID = 44414]
Page 9
[Option ID = 44415]
4.
[Option ID = 44416]
42) A school boy has 5 blue and 4 white marbles in his left pocket and 4 blue and 5 white marbles in his right pocket. If he transfers
one marble at random from his left to his right pocket. What is the probability of his then drawing a blue marble from his right pocket?
[Question ID = 11105]
1.
[Option ID = 44417]
2.
[Option ID = 44418]
3.
[Option ID = 44419]
4.
[Option ID = 44420]
43)
[Question ID = 11106]
1. A ‐ II, B ‐ III, C ‐ IV, D ‐ I [Option ID = 44421]
2. A ‐ III, B ‐ I, C ‐ II, D ‐ IV [Option ID = 44422]
3. A ‐ IV, B ‐ II, C ‐ III, D ‐ I [Option ID = 44423]
4. A ‐ I, B ‐ II, C ‐ III, D ‐ IV [Option ID = 44424]
44)
[Question ID = 11107]
1. A ‐ I, B ‐ II, C ‐ III, D ‐ IV
Page 10
2. A ‐ IV, B ‐ II, C ‐ III, D ‐ I
[Option ID = 44426]
3. A ‐ IV, B ‐ I, C ‐ III, D ‐ II
[Option ID = 44427]
4. A ‐ IV, B ‐ I, C ‐ II, D ‐ III
[Option ID = 44428]
45)
[Question ID = 11108]
1. Linearly Independent
[Option ID = 44429]
2. Linearly Dependent
[Option ID = 44430]
3. More than two vectors cannot be linearly dependent or linearly Independent
[Option ID = 44431]
4. Data Inadequate
[Option ID = 44432]
46)
[Question ID = 11109]
1. Only D
[Option ID = 44433]
2. A and C only
[Option ID = 44434]
3. A and D only
[Option ID = 44435]
4. B and C only
[Option ID = 44436]
Topic:‐ ECO PHD B
1) In economics as in most other disciplines, we use models to illustrate complex subjects, such as relationships between the economy
and the environment. In using these models, however, we should also be sensitive to their limitations. Models are simplified
characterizations of reality. For example, although a road map, by design, leaves a lot out, it is a useful guide to reality. The map shows
how various locations relate to each other and gives an overall perspective. It cannot, however, capture the unique details, which
characterize any particular location. The map highlights only those characteristics that are crucial for the purpose at hand.
Through simplification, less is held in view so that more can be understood of what is retained. Models allow us to rigorously study
issues, which are interrelated and global in scale, but, through their selectivity, models may yield conclusions that are wrong. What is
omitted may turn out, in retrospect, to be crucial in understanding a particular dimension. Models are therefore useful abstractions that
should always be viewed with skepticism. (Adapted from “Environmental and Natural Resource Economics,” Tom Tietenberg (2003))
Which of these statements follow from the above:
A. A model is a map
B. A map is a model
C. Models characterize reality
D. Maps are used in Economics
[Question ID = 11093]
1. Only A
[Option ID = 44369]
2. Only C
[Option ID = 44370]
3. Only B and C
[Option ID = 44371]
4. Only D
[Option ID = 44372]
2) In economics as in most other disciplines, we use models to illustrate complex subjects, such as relationships between the economy
and the environment. In using these models, however, we should also be sensitive to their limitations. Models are simplified
characterizations of reality. For example, although a road map, by design, leaves a lot out, it is a useful guide to reality. The map shows
how various locations relate to each other and gives an overall perspective. It cannot, however, capture the unique details, which
characterize any particular location. The map highlights only those characteristics that are crucial for the purpose at hand.
Page 11
issues, which are interrelated and global in scale, but, through their selectivity, models may yield conclusions that are wrong. What is
omitted may turn out, in retrospect, to be crucial in understanding a particular dimension. Models are therefore useful abstractions that
should always be viewed with skepticism. (Adapted from “Environmental and Natural Resource Economics,” Tom Tietenberg (2003))
“A map gives an overall perspective” means:[Question ID = 11094]
1. a map simplifies reality [Option ID = 44373]
2. a map highlights important characteristics [Option ID = 44374]
3. a map provides a complete picture [Option ID = 44375]
4. a map provides a useful guide to reality [Option ID = 44376]
3) In economics as in most other disciplines, we use models to illustrate complex subjects, such as relationships between the economy
and the environment. In using these models, however, we should also be sensitive to their limitations. Models are simplified
characterizations of reality. For example, although a road map, by design, leaves a lot out, it is a useful guide to reality. The map shows
how various locations relate to each other and gives an overall perspective. It cannot, however, capture the unique details, which
characterize any particular location. The map highlights only those characteristics that are crucial for the purpose at hand.
Through simplification, less is held in view so that more can be understood of what is retained. Models allow us to rigorously study
issues, which are interrelated and global in scale, but, through their selectivity, models may yield conclusions that are wrong. What is
omitted may turn out, in retrospect, to be crucial in understanding a particular dimension. Models are therefore useful abstractions that
should always be viewed with skepticism. (Adapted from “Environmental and Natural Resource Economics,” Tom Tietenberg (2003))
Models are used to:[Question ID = 11095]
1. show buildings [Option ID = 44377]
2. make maps [Option ID = 44378]
3. illustrate relationships [Option ID = 44379]
4. hide limitations [Option ID = 44380]
4) In economics as in most other disciplines, we use models to illustrate complex subjects, such as relationships between the economy
and the environment. In using these models, however, we should also be sensitive to their limitations. Models are simplified
characterizations of reality. For example, although a road map, by design, leaves a lot out, it is a useful guide to reality. The map shows
how various locations relate to each other and gives an overall perspective. It cannot, however, capture the unique details, which
characterize any particular location. The map highlights only those characteristics that are crucial for the purpose at hand.
Through simplification, less is held in view so that more can be understood of what is retained. Models allow us to rigorously study
issues, which are interrelated and global in scale, but, through their selectivity, models may yield conclusions that are wrong. What is
omitted may turn out, in retrospect, to be crucial in understanding a particular dimension. Models are therefore useful abstractions that
should always be viewed with skepticism. (Adapted from “Environmental and Natural Resource Economics,” Tom Tietenberg (2003))
Models simplify reality because:[Question ID = 11096]
1. their conclusions may be wrong [Option ID = 44381]
2. what they omit may be crucial [Option ID = 44382]
3. more can be understood of what is included [Option ID = 44383]
4. they should be viewed with skepticism. [Option ID = 44384]
Document Details
| Board / Org | NTA |
| Exam | DUET |
| Type | Question Paper |
| Pages | 11 |
| Language | english |
| Updated | 30 Apr 2026 |