NCERT Book Class 8 Maths Chapter 13 Introduction to Graphs
Finished viewing? Save it for later —
Download NCERT Book Class 8 Maths Chapter 13 Introduction to Graphs (PDF · 16 pages)About NCERT Book Class 8 Maths Chapter 13 Introduction to Graphs
NCERT Book Class 8 Maths Chapter 13 Introduction to Graphs is available here for free download. Published by NCERT for Class 8, this books can be viewed online or downloaded as a PDF (16 pages). Candidates preparing for Class 8 can use NCERT Book Class 8 Maths Chapter 13 Introduction to Graphs to understand the exam pattern, the type of questions asked, and the overall difficulty level.
Frequently Asked Questions
How can I download NCERT Book Class 8 Maths Chapter 13 Introduction to Graphs?
Open this page and click the Download button to save NCERT Book Class 8 Maths Chapter 13 Introduction to Graphs as a PDF. It is completely free on AglaSem Docs.
Is NCERT Book Class 8 Maths Chapter 13 Introduction to Graphs free to download?
Yes. NCERT Book Class 8 Maths Chapter 13 Introduction to Graphs can be viewed online and downloaded as a PDF free of cost on AglaSem Docs.
How many pages does NCERT Book Class 8 Maths Chapter 13 Introduction to Graphs have?
NCERT Book Class 8 Maths Chapter 13 Introduction to Graphs contains 16 pages, which you can read online or download together as a single PDF.
Where can I find more Class 8 study material?
You can find more Class 8 question papers, sample papers, syllabus, and answer keys on AglaSem Docs.
NCERT Book Class 8 Maths Chapter 13 Introduction to Graphs – Text
Read the full text of this books below — useful to quickly search, copy and reference the content online without downloading the PDF.
📄 View text version (1 page)
Page 1
CHAPTER
Introduction to Graphs
13
13.1 Introduction
Have you seen graphs in the newspapers, television, magazines, books etc.? The purpose
of the graph is to show numerical facts in visual form so that they can be understood
quickly, easily and clearly. Thus graphs are visual representations of data collected.
Data can also be presented in the form of a table; however a graphical presentation is
easier to understand. This is true in particular when there is a trend or comparison to
be shown.
We have already seen some types of graphs. Let us quickly recall them here.
13.1.1 A line graph
A line graph displays data that changes continuously over periods of time.
When Renu fell sick, her doctor maintained a record of her body temperature, taken
every four hours. It was in the form of a graph (shown in Fig 13.1 and Fig 13.2).
We may call this a “time-temperature graph”.
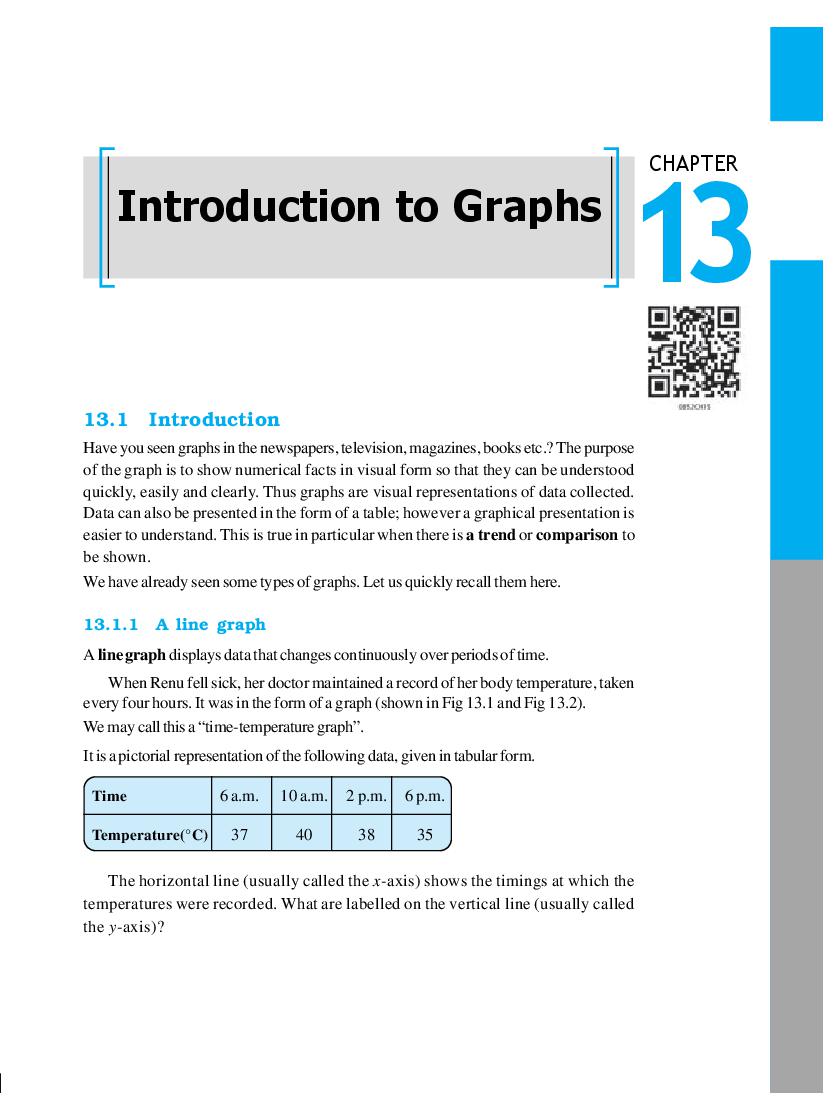
It is a pictorial representation of the following data, given in tabular form.
Time 6 a.m. 10 a.m. 2 p.m. 6 p.m.
Temperature(°C) 37 40 38 35
The horizontal line (usually called the x-axis) shows the timings at which the
temperatures were recorded. What are labelled on the vertical line (usually called
the y-axis)?
Showing the first page only. Download the PDF above for the complete document.
Document Details
| Board / Org | NCERT |
| Exam | Class 8 |
| Type | Books |
| Pages | 16 |
| Updated | 22 Jul 2026 |