ISC Class 11 Specimen Paper Artificial Intelligence
Finished viewing? Save it for later —
Download ISC Class 11 Specimen Paper Artificial Intelligence (PDF · 13 pages)About ISC Class 11 Specimen Paper Artificial Intelligence
ISC Class 11 Specimen Paper Artificial Intelligence is available here for free download. Published by CISCE for Class 11, this sample paper can be viewed online or downloaded as a PDF (13 pages). Candidates preparing for Class 11 can use ISC Class 11 Specimen Paper Artificial Intelligence to understand the exam pattern, the type of questions asked, and the overall difficulty level.
Frequently Asked Questions
How can I download ISC Class 11 Specimen Paper Artificial Intelligence?
Open this page and click the Download button to save ISC Class 11 Specimen Paper Artificial Intelligence as a PDF. It is completely free on AglaSem Docs.
Is ISC Class 11 Specimen Paper Artificial Intelligence free to download?
Yes. ISC Class 11 Specimen Paper Artificial Intelligence can be viewed online and downloaded as a PDF free of cost on AglaSem Docs.
How many pages does ISC Class 11 Specimen Paper Artificial Intelligence have?
ISC Class 11 Specimen Paper Artificial Intelligence contains 13 pages, which you can read online or download together as a single PDF.
Where can I find more Class 11 study material?
You can find more Class 11 question papers, sample papers, syllabus, and answer keys on AglaSem Docs.
ISC Class 11 Specimen Paper Artificial Intelligence – Text
Read the full text of this sample paper below — useful to quickly search, copy and reference the content online without downloading the PDF.
📄 View text version (13 pages)
Page 1
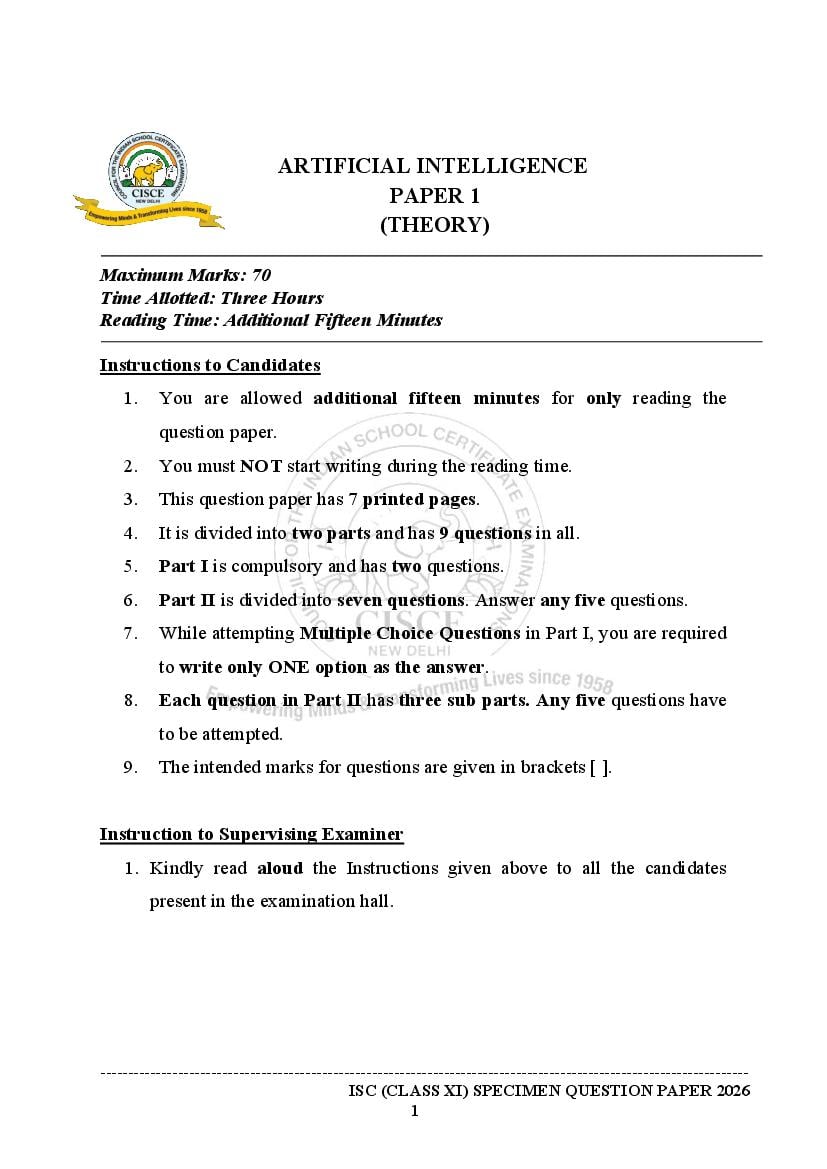
PAPER 1
(THEORY)
Maximum Marks: 70
Time Allotted: Three Hours
Reading Time: Additional Fifteen Minutes
Instructions to Candidates
1. You are allowed additional fifteen minutes for only reading the
question paper.
2. You must NOT start writing during the reading time.
3. This question paper has 7 printed pages.
4. It is divided into two parts and has 9 questions in all.
5. Part I is compulsory and has two questions.
6. Part II is divided into seven questions. Answer any five questions.
7. While attempting Multiple Choice Questions in Part I, you are required
to write only ONE option as the answer.
8. Each question in Part II has three sub parts. Any five questions have
to be attempted.
9. The intended marks for questions are given in brackets [ ].
Instruction to Supervising Examiner
1. Kindly read aloud the Instructions given above to all the candidates
present in the examination hall.
---------------------------------------------------------------------------------------------------------------------
1
Page 2
Board Examination Question Paper and should be used as a practice tool. The questions for the
Board Examination can be set from any part of the syllabus, though the format of the Board
Examination Question Paper will remain the same as that of the Specimen Question Paper.
The weightage allocated to various topics, as given in the syllabus, will be strictly adhered to.
PART I (20 MARKS)
Answer all questions.
While answering questions in this Part, indicate briefly your working and reasoning,
wherever required.
Question 1
(i) Which of the following is NOT a commonly used application of Artificial [1]
Intelligence? (Recall)
(a) Email Spam Filtering
(b) Online Shopping Recommendations
(c) Manual Typewriting
(d) Voice Assistants
(ii) Given below are two statements marked Assertion and Reason. Read the [1]
statements carefully and choose the correct option.
Assertion: Data cleaning improves the quality of data for analysis.
Reason: Data cleaning helps in generating random missing values for analysis.
(Analysis)
(a) Both Assertion and Reason are true and Reason is the correct explanation for
the Assertion.
(b) Both Assertion and Reason are true but Reason is not the correct explanation
for the Assertion.
(c) Assertion is true and Reason is false.
(d) Both Assertion and Reason are false.
(iii) Which stage in an AI project involves understanding the business issue and [1]
defining objectives? (Recall)
(a) Data Exploration
(b) Problem Scoping
(c) Modelling
(d) Evaluation
(iv) Which of the following is an example of a Natural Language Processing (NLP) [1]
application? (Recall)
(a) Image recognition
(b) Crop monitoring
(c) Language translation
(d) Transport management system
----------------------------------------------------------------------------------------------------------------------------------
2
Page 3
statements carefully and choose the correct option.
Assertion: The drop duplicates() method in Pandas is used to clean a dataset by
removing redundant entries.
Reason: Duplicated rows can lead to skewed or inaccurate results during data
analysis. (Analysis)
(a) Both Assertion and Reason are true and Reason is the correct explanation for
the Assertion.
(b) Both Assertion and Reason are true but Reason is not the correct explanation
for the Assertion.
(c) Assertion is true and Reason is false.
(d) Both Assertion and Reason are false.
(vi) Given below are two statements marked Assertion and Reason. Read the [1]
statements carefully and choose the correct option.
Assertion: AI systems can unintentionally amplify existing social biases in training
data.
Reason: Bias in AI arises only when developers deliberately add it. (Analysis)
(a) Both Assertion and Reason are true and Reason is the correct explanation
for the Assertion.
(b) Both Assertion and Reason are true but Reason is not the correct
explanation for the Assertion.
(c) Assertion is true and Reason is false.
(d) Both Assertion and Reason are false.
(vii) Which of the following operations is valid for two matrices of the same order? [1]
(Recall)
(a) Finding inverse
(b) Scalar product
(c) Determinant
(d) Addition
(viii) Which of the following measures is least affected by extreme values in a dataset? [1]
(Recall)
(a) Mean
(b) Median
(c) Mode
(d) Variance
(ix) Define artificial intelligence. Mention one application of AI in Transportation. [1]
(Recall)
(x) What is the primary goal of data visualisation in AI? (Recall) [1]
-----------------------------------------------------------------------------------------------------------------------------------
3
Page 4
(i) What is the difference between deterministic and probabilistic systems? Give one [2]
example of each. (Understanding)
(ii) Write a Python command using Matplotlib to display a line graph with x = [1, 2, 3] [2]
and y = [3, 2, 1]. (Create)
(iii) Mention two chart types and briefly state when each is most suitable. [2]
(Understanding)
(iv) Differentiate between dependent and independent variables in the context of [2]
regression analysis with one example. (Understanding)
(v) List two ethical responsibilities developers must consider while creating AI systems. [2]
(Recall)
PART II (50 MARKS)
Answer any five questions.
The answers in this section should consist of the programs in either python environment or
any program environment with python as the base.
Each program should be written using variable description / mnemonic codes so that the
logic of the program is clearly depicted.
Question 3
(i) Explain the role of AI in improving healthcare and agriculture. Mention two [4]
specific uses for each domain. (Application & Analysis)
(ii) Write a Python function check_even_odd(n) that takes a number as input and prints [3]
whether it is even or odd. Also, call the function with n = 7. (Create)
(iii) Differentiate between Machine Learning (ML) and Deep Learning (DL). [3]
Mention one real-world application of each. (Understanding)
Question 4
(i) Compare Matplotlib and Seaborn libraries in terms of features, ease of use, and [4]
application. Which one would you recommend for statistical plots? (Analysis)
(ii) Explain the advantages of using data visualisation in the field of AI. [3]
(Understanding)
(iii) Write a Python program using Matplotlib to create a bar chart showing the number [3]
of students interested in three domains: AI (30), Robotics (20), IoT (15) (Create)
----------------------------------------------------------------------------------------------------------------------------------
4
Page 5
(i) As a data analyst for the company Shopping Paradise, you are analysing data of
online customer purchases. The data from two tables is given below:
ID NAME CITY
Table A: Customer Info
1 AMAN DELHI
2 BEENA MUMBAI
3 CHITRA CHENNAI
ID PRODUCT PRICE
Table B: Purchases
2 LAPTOP 55000
1 KEYBOARD 1500
3 MOUSE 600
Answer the following:
(a) Identify the type of join needed to combine customer details with their [1]
purchases. (Application)
(b) Perform the join and write the resulting table. (Application) [1]
(c) Explain how this is an application of Set Theory in AI data preparation. [2]
(Analysis)
(ii) Consider the matrices and perform the below: (Application)
(a) Perform A + B [1]
(b) Find the transpose of matrix A [1]
(c) Determine the product A × B [1]
(iii) A dataset records the scores of 5 students in a test: 55, 60, 65, 70, 95.
(Application)
(a) Calculate the mean score. [1]
(b) Identify the median. [1]
(c) Is the mode defined for this dataset? Justify your answer. [1]
-----------------------------------------------------------------------------------------------------------------------------------
5
Page 6
(i) You downloaded a CSV file from Kaggle containing missing values, duplicate
entries, and inconsistent column formatting.
Write a Python program using Pandas to: (Create)
(a) Load the file. [1]
(b) Remove duplicates. [1]
(c) Fill the missing values with the column mean. [1]
(d) Convert a column called City to title case. [1]
(ii) What are the three common data cleaning tasks performed before analysing a [3]
dataset? Illustrate each briefly. (Understanding)
(iii) What is the purpose of a Least Squares Regression Line in Linear Regression? [3]
Explain how it is determined. (Understanding)
Question 7
(i) The table below shows the number of hours studied and marks obtained by students: [4]
Hours Studied (X) Marks (Y)
2 50
3 60
5 80
Using the method of least squares, find the linear regression equation of Y on X.
(Application)
(ii) List and briefly describe any three types of data models used in data modelling. [3]
(Understanding)
(iii) Explain with an example how poor ethical considerations in AI design can [3]
negatively impact society. (Evaluate)
Question 8
(i) You are working with a Kaggle dataset on housing prices. Write a Python code to:
(Create)
(a) Remove duplicate rows [1]
(b) Handle missing values in the 'Price' column [1]
(c) Standardize the 'Area' column using z-score normalization [2]
(ii) Differentiate between Narrow AI, General AI, and Superintelligent AI with one [3]
real-world or hypothetical example for each. (Understanding)
----------------------------------------------------------------------------------------------------------------------------------
6
Page 7
completed by four students: A: 3, B: 5, C: 2, D: 4 (Create)
Question 9
(i) You are given a dataset containing the number of study hours and corresponding
student scores.
You plan to apply Linear Regression to predict scores.
Before that, answer the following: (Analysis)
(a) What type of data modelling is suitable for this problem and why? [1]
(Application)
(b) Define dependent and independent variables in this context. (Analysis) [1]
(c) Explain why bias in data collection must be avoided when training this [2]
model. (Understanding)
(ii) Describe the role of data acquisition and data exploration in an AI project. [3]
Why are these steps critical? (Understanding)
(iii) Explain how environmental concerns should be addressed in AI development. [3]
Provide one example. (Evaluate)
-----------------------------------------------------------------------------------------------------------------------------------
7
Page 8
PAPER 1
(THEORY)
ANSWER KEY
PART I (20 MARKS)
Question 1
(i) (c) or Manual Typewriting [1]
(ii) (c) or Assertion is true and Reason is false. [1]
(iii) (b) or Problem Scoping [1]
(iv) (c) or Language translation [1]
(v) (a) or Both Assertion and Reason are true and Reason is the correct explanation [1]
for the Assertion.
(vi) (c) or Assertion is true and Reason is false. [1]
(vii) (d) or Addition [1]
(viii) (b) or Median [1]
(ix) Artificial Intelligence is the ability of machines to mimic human intelligence and [1]
perform tasks such as learning, reasoning, and problem-solving. One application
in transportation is AI driven traffic Management Systems.
(x) To represent data graphically for easier understanding of patterns, trends, and [1]
insights.
Question 2
(i) Deterministic systems always produce the same output for a given input. [2]
Example: A calculator performing 2 + 2.
Probabilistic systems may produce different outcomes for the same input due to
uncertainty. Example: A weather prediction model.
(ii) import matplotlib.pyplot as plt [2]
plt.plot([1, 2, 3], [3, 2, 1])
plt.show()
(iii) Bar Chart - Best for comparing values across categories. [2]
Scatter Plot- Useful to identify relationships or correlations between two variables.
---------------------------------------------------------------------------------------------------------------------
ISC (CLASS XI) SPECIMEN ANSWER KEY 2026
1
Page 9
Independent Variable: The predictor or input variable (e.g., square footage).
Example: In predicting a student’s score based on hours studied:
Hours studied → Independent variable
Exam score → Dependent variable
(v) Ensuring the privacy and security of user data. Minimizing algorithmic bias to [2]
promote fairness and equity.
PART II (50 Marks)
Question 3
(i) In Healthcare: [4]
1. Diagnosis Enhancement – AI helps doctors detect diseases early using image-
based diagnosis like X-rays and MRIs.
2. Personalized Treatment Plans – AI analyses patient data to recommend
personalized treatment options.
In Agriculture:
1. Precision Farming – AI tools monitor soil health, weather, and crop conditions to
optimize farming.
2. Yield Prediction – AI models forecast crop output, helping farmers plan harvest
and sales.
(ii) def check_even_odd(n): [3]
if n % 2 == 0:
print("Even") else:
print("Odd")
check_even_odd(7)
(iii) Machine Learning (ML) is a subset of AI where algorithms learn from data and [3]
make predictions or decisions. Example: Email spam filtering. Deep Learning (DL)
is a subset of ML that uses neural networks with many layers to model complex
patterns.
Example: Facial recognition in images.
Question 4
(i) Matplotlib: Low-level, flexible, great for custom plots but requires more code [4]
Seaborn: Built on top of Matplotlib, provides high-level, attractive, and informative
statistical graphics
Ease of use: Seaborn has simpler syntax for complex visualizations
Recommendation: Seaborn is better for statistical plots like boxplots and heatmaps
due to built-in features and aesthetics
--------------------------------------------------------------------------------------------------------------------------------
ISC (CLASS XI) SPECIMEN ANSWER KEY 2026
2
Page 10
○ Identifies trends, outliers, and relationships
○ Aids in communicating results clearly to stakeholders
(iii) import matplotlib.pyplot as plt [3]
domains = ['AI', 'Robotics', 'IoT']
students = [30, 20, 15]
plt.bar(domains, students)
plt.title('Student Interests')
plt.ylabel('Number of Students')
plt.show()
Question 5
(i) (a) Type of Join: Inner Join on the column ID. [1]
(b) Resulting Table (after join): [1]
ID Name City Product Price
1 Aman Delhi Keyboard 1500
2 Beena Mumbai Laptop 55000
3 Chitra Chennai Mouse 600
(c) This operation links two sets (Customer Info and Purchases) by a common [2]
attribute (ID), a classic application of Set Theory and Relational Algebra.
Joins are used in AI to combine datasets for training models or generating
features from multiple tables.
(ii) (a) [1]
(b) [1]
(c) [1]
(iii) Dataset: 55, 60, 65, 70, 95
(a) Mean = (55 + 60 + 65 + 70 + 95) / 5 = 69. [1]
(b) Median = 65 (middle value of ordered list) [1]
(c) Mode = Not defined / No mode. All values are unique, so no value repeats. [1]
--------------------------------------------------------------------------------------------------------------------------------
ISC (CLASS XI) SPECIMEN ANSWER KEY 2026
3
Page 11
(i) import pandas as pd
(a) df = pd.read_csv('dataset.csv') [1]
(b) df = df.drop_duplicates() [1]
(c) df = df.fillna(df.mean(numeric_only=True)) [1]
(d) df['City'] = df['City'].str.title() [1]
(ii) Removing Duplicates – Eliminate repeated rows using drop_duplicates() [3]
Handling Missing Values – Fill or drop rows with NaN using fillna() or dropna()
Correcting Inconsistent Data – Standardize formats or fix spelling using mapping or
string functions
(iii) The Least Squares Regression Line minimizes the sum of the squared differences [3]
between observed and predicted values. It is determined by calculating the slope
and intercept that minimize the total squared residuals (errors) using statistical
formulas.
Question 7
(i) The linear regression equation is of the form Y=a+bX, where: [4]
• b is the slope of the line.
• a is the y-intercept.
The formulas to calculate b and a are:
The linear regression equation.
Substitute the values of a=30 and b=10 into the equation Y=a+bX:
Y=30+10X
The linear regression equation of Y on X is Y=30+10X.
--------------------------------------------------------------------------------------------------------------------------------
ISC (CLASS XI) SPECIMEN ANSWER KEY 2026
4
Page 12
Dimensional Model – Optimized for data warehousing, involving fact and
dimension tables.
Entity-Relational Model – Uses entities, attributes, and relationships to design a
conceptual schema of data.
(iii) If a facial recognition system is trained primarily on lighter-skinned faces, it may [3]
misidentify or fail to recognize individuals with darker skin tones. This can lead to
discrimination, such as wrongful accusations or denial of services, thereby causing
social harm and undermining public trust in AI.
Question 8
(i) import pandas as pd
from scipy.stats import zscore
df = pd.read_csv("housing.csv")
(a) df = df.drop_duplicates() [1]
(b) df['Price'] = df['Price'].fillna(df['Price'].mean()) [1]
(c) df['Area'] = zscore(df['Area']) [2]
(ii) ○ Narrow AI: Google Maps (specific task) [3]
○ General AI: A robot with human-like reasoning (still theoretical)
○ Superintelligent AI: Exceeds human intelligence (hypothetical future)
(iii) import matplotlib.pyplot as plt [3]
names = ['A', 'B', 'C', 'D']
projects = [3, 5, 2, 4]
plt.bar(names, projects)
plt.xlabel('Students')
plt.ylabel('AI Projects')
plt.title('Projects Completed')
plt.show()
Question 9
(i) (a) Relational data modelling is suitable, as the data can be stored in a structured [1]
format (rows and columns) with a clear relationship between attributes (study
hours ↔ scores)
(b) Independent variable: Study hours (input), Dependent variable: Scores [1]
(output).
(c) Bias can lead to unfair or inaccurate predictions. For example, if the dataset [2]
only includes high-performing students, the model will overestimate scores
for students who study less, making it unreliable and ethically problematic.
--------------------------------------------------------------------------------------------------------------------------------
ISC (CLASS XI) SPECIMEN ANSWER KEY 2026
5
Page 13
Data Exploration: Understanding patterns, distributions, and anomalies in data.
These steps ensure data quality and guide the modelling direction.
(iii) AI systems should be designed to optimize energy efficiency, use sustainable [3]
hardware, and minimize carbon footprint.
Example: Training smaller ML models instead of massive ones to reduce energy
consumption in data centers.
--------------------------------------------------------------------------------------------------------------------------------
ISC (CLASS XI) SPECIMEN ANSWER KEY 2026
6