JNUEE 2021 Question Paper MA Economics
Finished viewing? Save it for later —
Download JNUEE 2021 Question Paper MA Economics (PDF · 17 pages)About JNUEE 2021 Question Paper MA Economics
JNUEE 2021 Question Paper MA Economics is available here for free download. Published by NTA for Jawaharlal Nehru University Entrance Examination, this question paper can be viewed online or downloaded as a PDF (17 pages). Candidates preparing for Jawaharlal Nehru University Entrance Examination can use JNUEE 2021 Question Paper MA Economics to understand the exam pattern, the type of questions asked, and the overall difficulty level.
Frequently Asked Questions
How can I download JNUEE 2021 Question Paper MA Economics?
Open this page and click the Download button to save JNUEE 2021 Question Paper MA Economics as a PDF. It is completely free on AglaSem Docs.
Is JNUEE 2021 Question Paper MA Economics free to download?
Yes. JNUEE 2021 Question Paper MA Economics can be viewed online and downloaded as a PDF free of cost on AglaSem Docs.
How many pages does JNUEE 2021 Question Paper MA Economics have?
JNUEE 2021 Question Paper MA Economics contains 17 pages, which you can read online or download together as a single PDF.
Where can I find more Jawaharlal Nehru University Entrance Examination study material?
You can find more Jawaharlal Nehru University Entrance Examination question papers, sample papers, syllabus, and answer keys on AglaSem Docs.
JNUEE 2021 Question Paper MA Economics – Text
Read the full text of this question paper below — useful to quickly search, copy and reference the content online without downloading the PDF.
📄 View text version (17 pages)
Page 1
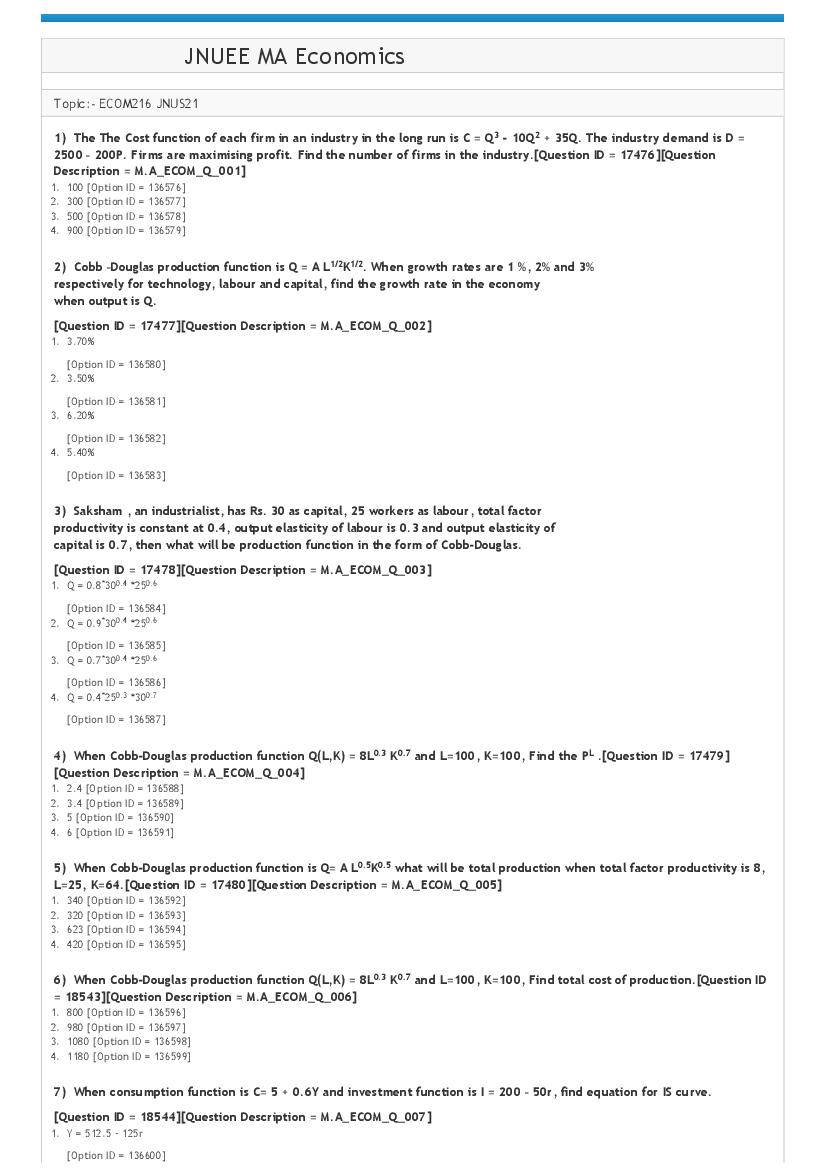
Topic:‐ ECOM216 JNUS21
1) The The Cost function of each firm in an industry in the long run is C = Q3 ‐ 10Q2 + 35Q. The industry demand is D =
2500 – 200P. Firms are maximising profit. Find the number of firms in the industry.[Question ID = 17476][Question
Description = M.A_ECOM_Q_001]
1. 100 [Option ID = 136576]
2. 300 [Option ID = 136577]
3. 500 [Option ID = 136578]
4. 900 [Option ID = 136579]
2) Cobb –Douglas production function is Q = A L1/2K1/2. When growth rates are 1 %, 2% and 3%
respectively for technology, labour and capital, find the growth rate in the economy
when output is Q.
[Question ID = 17477][Question Description = M.A_ECOM_Q_002]
1. 3.70%
[Option ID = 136580]
2. 3.50%
[Option ID = 136581]
3. 6.20%
[Option ID = 136582]
4. 5.40%
[Option ID = 136583]
3) Saksham , an industrialist, has Rs. 30 as capital, 25 workers as labour, total factor
productivity is constant at 0.4, output elasticity of labour is 0.3 and output elasticity of
capital is 0.7, then what will be production function in the form of Cobb‐Douglas.
[Question ID = 17478][Question Description = M.A_ECOM_Q_003]
1. Q = 0.8*300.4 *250.6
[Option ID = 136584]
2. Q = 0.9*300.4 *250.6
[Option ID = 136585]
3. Q = 0.7*300.4 *250.6
[Option ID = 136586]
4. Q = 0.4*250.3 *300.7
[Option ID = 136587]
4) When Cobb‐Douglas production function Q(L,K) = 8L0.3 K0.7 and L=100, K=100, Find the PL .[Question ID = 17479]
[Question Description = M.A_ECOM_Q_004]
1. 2.4 [Option ID = 136588]
2. 3.4 [Option ID = 136589]
3. 5 [Option ID = 136590]
4. 6 [Option ID = 136591]
5) When Cobb‐Douglas production function is Q= A L0.5K0.5 what will be total production when total factor productivity is 8,
L=25, K=64.[Question ID = 17480][Question Description = M.A_ECOM_Q_005]
1. 340 [Option ID = 136592]
2. 320 [Option ID = 136593]
3. 623 [Option ID = 136594]
4. 420 [Option ID = 136595]
6) When Cobb‐Douglas production function Q(L,K) = 8L0.3 K0.7 and L=100, K=100, Find total cost of production.[Question ID
= 18543][Question Description = M.A_ECOM_Q_006]
1. 800 [Option ID = 136596]
2. 980 [Option ID = 136597]
3. 1080 [Option ID = 136598]
4. 1180 [Option ID = 136599]
7) When consumption function is C= 5 + 0.6Y and investment function is I = 200 – 50r, find equation for IS curve.
[Question ID = 18544][Question Description = M.A_ECOM_Q_007]
1. Y = 512.5 – 125r
[Option ID = 136600]
Page 2
[Option ID = 136601]
3. Y = 530.5 – 125r
[Option ID = 136602]
4. Y = 612.5 – 5r
[Option ID = 136603]
8) When consumption function is C= 15 + 0.5Yd and investment function is I = 150 – 10r, G = 20 =T, find equation for IS
curve.
[Question ID = 18545][Question Description = M.A_ECOM_Q_008]
1. Y= 350 ‐20r
[Option ID = 136604]
2. Y= 440 ‐40r
[Option ID = 136605]
3. Y= 350 ‐40r
[Option ID = 136606]
4. Y= 470 ‐40r
[Option ID = 136607]
9) When money demand function Md = 0.5 Y – 50r money supply function Ms = 1000 Crore, Find LM curve equation.
[Question ID = 18546][Question Description = M.A_ECOM_Q_009]
1. Y = 2000 + 100r
[Option ID = 136608]
2. Y = 3000 + 100r
[Option ID = 136609]
3. Y = 4000 + 100r
[Option ID = 136610]
4. Y = 26000 + 100r
[Option ID = 136611]
10) A farmer has 2.5 Acre of land on which he cultivates 4 times in a year 2020. What is Net Sown Area in this case?
[Question ID = 18547][Question Description = M.A_ECOM_Q_010]
1. 2.5 acres
[Option ID = 136612]
2. 10 acres
[Option ID = 136613]
3. 12.5 acres
[Option ID = 136614]
4. 3.5 acres
[Option ID = 136615]
11) A farmer has 2.5 acre of land on which he cultivates kharif and Rabi crops. What will be cropping intensity?
[Question ID = 18548][Question Description = M.A_ECOM_Q_011]
1. 200%
[Option ID = 136616]
2. 400%
[Option ID = 136617]
3. 100%
[Option ID = 136618]
4. 240%
[Option ID = 136619]
12) A farmer has 10.00 acres of land on which he crops paddy on 10.00 acres, wheat on 7 acres and lentils on 3 acres in a
year. What will be cropping intensity?
[Question ID = 18549][Question Description = M.A_ECOM_Q_012]
1. 200%
[Option ID = 136620]
2. 400%
[Option ID = 136621]
3. 500%
[Option ID = 136622]
Page 3
[Option ID = 136623]
13) Suppose you have two options either to go to club or to work to earn. In both cases time spent is 5 hours. You are
willing to spend Rs. 125 for clubbing for which you spent Rs. 75 for ticket. If you work, get Rs. 10 per hour. What will be
opportunity cost of clubbing?
[Question ID = 18550][Question Description = M.A_ECOM_Q_013]
1. 125
[Option ID = 136624]
2. 135
[Option ID = 136625]
3. 175
[Option ID = 136626]
4. 185
[Option ID = 136627]
14) The budget for movie is Rs. 300 out of which you have to spend Rs. 150 for ticket. You have other option to go to work
to earn Rs. 200. Should you go for movie?
[Question ID = 18551][Question Description = M.A_ECOM_Q_014]
1. No
[Option ID = 136628]
2. Yes
[Option ID = 136629]
3. Can’t say
[Option ID = 136630]
4. Half
[Option ID = 136631]
15) The domestic demand function (D) of petrol in Uttar Pradesh is 1000 – 5P and Supply (S) function is 500 + 10P. The
domestic demand (D) of petrol in Iran is 1200‐20P and domestic supply (S) = 1500 + 15P. What will be price of petrol when
Uttar Pradesh imports from Iran?
[Question ID = 18552][Question Description = M.A_ECOM_Q_015]
1. 4
[Option ID = 136632]
2. 5
[Option ID = 136633]
3. 8
[Option ID = 136634]
4. 9
[Option ID = 136635]
16) The domestic demand function (D) of petrol in India is 1000 – 5P and Supply (S) function is 500 + 10P. The domestic
demand (D) of petrol in Iran is 1200‐20P and domestic supply (S) = 1500 + 15P. When India completely bans the import
from Iran to encourage domestic production, what will be the price of petrol?
[Question ID = 18553][Question Description = M.A_ECOM_Q_016]
1. 33.33
[Option ID = 136636]
2. 40
[Option ID = 136637]
3. 66
[Option ID = 136638]
4. 77.77
[Option ID = 136639]
17) Suppose India imports Lentils from USA at the price (P) of $ 20 per kg. The domestic demand (D) =1200 ‐10P and
domestic supply (S) = 200 + 40P. What will be the effect of fixing import quota of 200 kg on price?
[Question ID = 18554][Question Description = M.A_ECOM_Q_017]
1. Price will decrease by $4 /kg
[Option ID = 136640]
2. Price will increase by $4 /kg
[Option ID = 136641]
3. Price will decrease by $8 /kg
Page 4
4. Price will increase by $8 /kg
[Option ID = 136643]
18) When marginal rate of tax (MRT) is 2/3 and MPCd is 8/10, find MPC.[Question ID = 18555][Question Description =
M.A_ECOM_Q_018]
1. 5/78 [Option ID = 136644]
2. 3/7 [Option ID = 136645]
3. 8/30 [Option ID = 136646]
4. 18 [Option ID = 136647]
19) When MPC = 1/4, MRT (Marginal rate of tax) = 9/10 and change in the government expenditure (ΔG) =1, find the
increase in tax?
[Question ID = 18556][Question Description = M.A_ECOM_Q_019]
1. 6/5
[Option ID = 136648]
2. 11/16
[Option ID = 136649]
3. 15
[Option ID = 136650]
4. 2
[Option ID = 136651]
20) When MPCd =1/4 . Find the impact of the budget deficit of Rs. 2 on consumption.[Question ID = 18557][Question
Description = M.A_ECOM_Q_020]
1. 2/3 [Option ID = 136652]
2. 8 [Option ID = 136653]
3. 6 [Option ID = 136654]
4. 4/5 [Option ID = 136655]
21) When MRT =2/3, change in the government expenditure (ΔG) =1, MPC = 1/6, find budget
deficit.
[Question ID = 18558][Question Description = M.A_ECOM_Q_021]
1. 1/5 [Option ID = 136656]
2. 1/6 [Option ID = 136657]
3. 1/4 [Option ID = 136658]
4. 1/7 [Option ID = 136659]
22) When MPC=1/4, change in the government expenditure (ΔG) =1, find change in consumption
[Question ID = 18559][Question Description = M.A_ECOM_Q_022]
1. 1/3
[Option ID = 136660]
2. 1/5
[Option ID = 136661]
3. 1/8
[Option ID = 136662]
4. 0
[Option ID = 136663]
23) When MPCd =1/5, MPC = 1/4, find tax multiplier.
[Question ID = 18560][Question Description = M.A_ECOM_Q_023]
1. 4/15
[Option ID = 136664]
2. 2/15
[Option ID = 136665]
3. 1/71
[Option ID = 136666]
4. 1/17
[Option ID = 136667]
24) When MPCd =2/5, change in the government expenditure (ΔG) =1, change in the tax (ΔT) =1/10, find fiscal policy
multiplier.
[Question ID = 18561][Question Description = M.A_ECOM_Q_024]
1. 3/5
Page 5
2. 3/7
[Option ID = 136669]
3. 1/8
[Option ID = 136670]
4. 17
[Option ID = 136671]
25) When change in the government expenditure (ΔG) =2, change in the tax (ΔT) =2, what will be impact of fiscal policy
on change of consumption ( ΔC)?
[Question ID = 17621][Question Description = M.A_ECOM_Q_025]
1. 0
[Option ID = 136672]
2. 1
[Option ID = 136673]
3. 2
[Option ID = 136674]
4. 3
[Option ID = 136675]
26) When marginal Rate of tax (MRT) is 1/5 and marginal propensity to consume out of disposable income (MPCd ) is 3/5,
Find marginal Propensity to consume(MPC).
[Question ID = 17622][Question Description = M.A_ECOM_Q_026]
1. 2/5
[Option ID = 136676]
2. 3/7
[Option ID = 136677]
3. 12/25
[Option ID = 136678]
4. 4/9
[Option ID = 136679]
27) When average tax rate (ATR) = 1/3, Marginal rate of tax (MRT)=1/5, what type of tax is it?
[Question ID = 17623][Question Description = M.A_ECOM_Q_027]
1. Regressive
[Option ID = 136680]
2. Progressive
[Option ID = 136681]
3. Both
[Option ID = 136682]
4. NEGATIVE
[Option ID = 136683]
28) When Lorenz function f(X) = X3.3, find Gini coefficient.[Question ID = 17624][Question Description =
M.A_ECOM_Q_028]
1. 53.48 [Option ID = 136684]
2. 56.18 [Option ID = 136685]
3. 23.18 [Option ID = 136686]
4. 11.11 [Option ID = 136687]
29) When MC= 10 + 0.4X, MR=30 – 0.6X, damage borne by society is 10 in the case of externality, find the dead weight
loss (DWL).
[Question ID = 17625][Question Description = M.A_ECOM_Q_029]
1. 50
[Option ID = 136688]
2. 60
[Option ID = 136689]
3. 40
[Option ID = 136690]
4. 80
[Option ID = 136691]
30) When MC= 10 + 0.4X, MR=30 – 0.6X, damage borne by society is 10 in the case of externality, find the government
Page 6
[Question ID = 17626][Question Description = M.A_ECOM_Q_030]
1. 100
[Option ID = 136692]
2. 200
[Option ID = 136693]
3. 300
[Option ID = 136694]
4. 400
[Option ID = 136695]
31) When MC= 10 + 0.4X, MR=30 – 0.6X, damage borne by society is 10 in the case of externality, find the consumer loss
when the government interferes the externality.
[Question ID = 17627][Question Description = M.A_ECOM_Q_031]
1. 90
[Option ID = 136696]
2. 200
[Option ID = 136697]
3. 300
[Option ID = 136698]
4. 400
[Option ID = 136699]
32) When MC= 10 + 0.4X, MR=30 – 0.6X, damage borne by society is 10, find the producer loss when the government
interferes the externality.
[Question ID = 17628][Question Description = M.A_ECOM_Q_032]
1. 60
[Option ID = 136700]
2. 200
[Option ID = 136701]
3. 300
[Option ID = 136702]
4. 1100
[Option ID = 136703]
33) When IS=1500 – 50r, money supply = 500, price (p) =2, Md /p = Y – 50r, find the interest rate.[Question ID = 17629]
[Question Description = M.A_ECOM_Q_033]
1. 12.50 [Option ID = 136704]
2. 13.60 [Option ID = 136705]
3. 14.23 [Option ID = 136706]
4. 1200 [Option ID = 136707]
34) When LM = 1000 + 200r, C = 800 + 0.5 (Y‐T), T=50, G=50, I = 100 – 5r, find interest rate.[Question ID = 17630]
[Question Description = M.A_ECOM_Q_034]
1. 4.04 [Option ID = 136708]
2. 3.06 [Option ID = 136709]
3. 5.06 [Option ID = 136710]
4. 8.02 [Option ID = 136711]
35) When IS= 1850 – 100r, LM= 1000 + 200r, find equilibrium income.[Question ID = 17631][Question Description =
M.A_ECOM_Q_035]
1. 1567 [Option ID = 136712]
2. 1667 [Option ID = 136713]
3. 1767 [Option ID = 136714]
4. 1845 [Option ID = 136715]
36) When C=20 + 0.5Y, and change in investment (ΔI) = 400, find change in income (Δy).[Question ID = 17632][Question
Description = M.A_ECOM_Q_036]
1. 800 [Option ID = 136716]
2. 13.5 [Option ID = 136717]
3. 23 [Option ID = 136718]
4. 4.5 [Option ID = 136719]
37) What will be Keynesian multiplier when C= 10 + 0.8 Y and Import (M) = ‐ 6 + 0.3Y[Question ID = 17633][Question
Description = M.A_ECOM_Q_037]
1. 2 [Option ID = 136720]
Page 7
3. 4 [Option ID = 136722]
4. 5 [Option ID = 136723]
38) Net Imports of Petroleum and Petroleum products (Million Tons) in the year 2019‐20 (Provisional) were?
[Question ID = 17634][Question Description = M.A_ECOM_Q_038]
1. ‐21.9 Million Tons
[Option ID = 136724]
2. 21.9 Million Tons
[Option ID = 136725]
3. 6.0 Million Tons
[Option ID = 136726]
4. ‐6.0 Million Tons
[Option ID = 136727]
39) Arrange the following principal exports group in ascending order (value in million dollars) in the year 2019‐20.
[Question ID = 17635][Question Description = M.A_ECOM_Q_039]
1. Agricultural and allied products; Manufactured goods; Mineral fuel and lubricants (incl. coal); Ores and minerals (excl. coal)
[Option ID = 136728]
2. Manufactured goods; Ores and minerals (excl. coal); Mineral fuel and lubricants (incl. coal); Agricultural and allied products
[Option ID = 136729]
3. Ores and minerals (excl. coal); Agricultural and allied products; Mineral fuel and lubricants Ores and minerals (excl. coal); Agricultural and allied
products; Mineral fuel and lubricants
[Option ID = 136730]
4. Mineral fuel and lubricants (incl. coal); Manufactured goods; Agricultural and allied products; Ores and minerals (excl. coal)
[Option ID = 136731]
40) Arrange the following state, in ascending order of total fertility rate, in per cent, in the year 2018:
[Question ID = 17636][Question Description = M.A_ECOM_Q_040]
1. Bihar; Uttar Pradesh; Madhya Pradesh; Kerala
[Option ID = 136732]
2. Uttar Pradesh; Madhya Pradesh; Bihar; Kerala
[Option ID = 136733]
3. Kerala; Madhya Pradesh; Uttar Pradesh; Bihar
[Option ID = 136734]
4. Bihar; Kerala; Uttar Pradesh; Madhya Pradesh
[Option ID = 136735]
41) Arrange the following state, in ascending order of life expectancy at birth (years 2014‐18): [Question ID = 17637]
[Question Description = M.A_ECOM_Q_041]
1. Uttar Pradesh; Bihar; Jammu & Kashmir; Kerala [Option ID = 136736]
2. Kerala; Uttar Pradesh; Bihar; Jammu & Kashmir [Option ID = 136737]
3. Bihar; Jammu & Kashmir; Kerala; Uttar Pradesh [Option ID = 136738]
4. Uttar Pradesh; Jammu & Kashmir; Kerala; Bihar [Option ID = 136739]
42) Arrange the following Indian states, in ascending order of Gross Enrolment Ratio (per cent) in Higher Education (18‐23
years age group) in the Year 2018‐19:
[Question ID = 17638][Question Description = M.A_ECOM_Q_042]
1. Bihar; Andhra Pradesh; Tamil Nadu; Uttar Pradesh
[Option ID = 136740]
2. Andhra Pradesh; Tamil Nadu; Uttar Pradesh; Bihar
[Option ID = 136741]
3. Bihar; Uttar Pradesh; Andhra Pradesh; Tamil Nadu
[Option ID = 136742]
4. Tamil Nadu; Andhra Pradesh; Uttar Pradesh; Bihar
[Option ID = 136743]
43)
Which of the following statement is not correct?
[Question ID = 18562][Question Description = M.A_ECOM_Q_043]
1. In India, total population of age group 60 and above from 2001 to 2011 has increased. [Option ID = 136744]
2. In India, total population of age group 60 and above from 2001 to 2011 has decreased. [Option ID = 136745]
3. In India, total population of age group 0 ‐ 14 years from 2001 to 2011 has decreased. [Option ID = 136746]
4. In India, child sex ratio (0 ‐ 6 years) from 2001 to 2011 has increased. [Option ID = 136747]
Page 8
[Question ID = 18563][Question Description = M.A_ECOM_Q_044]
1. Punjab; Chhattisgarh; Gujarat; Haryana
[Option ID = 136748]
2. Gujarat; Punjab; Haryana; Chhattisgarh
[Option ID = 136749]
3. Chhattisgarh; Gujarat; Punjab; Haryana
[Option ID = 136750]
4. Haryana; Chhattisgarh; Gujarat; Punjab
[Option ID = 136751]
45) Which of the following statement is not correct?
[Question ID = 18564][Question Description = M.A_ECOM_Q_045]
1. Percentage decadal growth rate of population (1991‐2001) of Kerala was the minimum amongst all the Indian states.
[Option ID = 136752]
2. Percentage decadal growth rate of population, for Tamil Nadu in the decade 1991‐2001 was higher than that of the decade 2001‐2011.
[Option ID = 136753]
3. Percentage decadal growth rate of population, for all India in the decade 1991‐2001 was higher than that of the decade 2001‐2011.
[Option ID = 136754]
4. Percentage decadal growth rate of population, for all India in the decade 2001‐2011 was lower than that of the decade 1991‐2001.
[Option ID = 136755]
46) Poverty Headcount Ratio (HCR) in the year 2011‐12 was 21.9 for all India, what was the HCR
for the year 2009‐10?
[Question ID = 18565][Question Description = M.A_ECOM_Q_046]
1. 38.8 [Option ID = 136756]
2. 39.9 [Option ID = 136757]
3. 19.9 [Option ID = 136758]
4. 29.8 [Option ID = 136759]
47) A large speculative demand for money is likely to exist when [Question ID = 18566][Question Description =
M.A_ECOM_Q_047]
1. People wish to borrow money in order to speculate in the stock exchange [Option ID = 136760]
2. The current rate of interest is high [Option ID = 136761]
3. The current rate of interest is lower than people expect it to be in the near future [Option ID = 136762]
4. GST [Option ID = 136763]
48) Disinflation is a situation when [Question ID = 18567][Question Description = M.A_ECOM_Q_048]
1. Inflation is slowing down over a period of time [Option ID = 136764]
2. Inflation is negative over a period of time [Option ID = 136765]
3. Inflation is increasing and positive over a period of time [Option ID = 136766]
4. monetisation [Option ID = 136767]
49) In a moderately symmetrical distribution, mean, median and mode are connected by [Question ID = 18568][Question
Description = M.A_ECOM_Q_049]
1. Mode=2 median‐3 mean [Option ID = 136768]
2. Mode=3 median‐4 mean [Option ID = 136769]
3. Mode=3 median‐2 mean [Option ID = 136770]
4. Mode=2 median‐4 mean [Option ID = 136771]
50) The algebraic sum of deviation of a set of n values from their mean is [Question ID = 18569][Question Description =
M.A_ECOM_Q_050]
1. 0 [Option ID = 136772]
2. n‐1 [Option ID = 136773]
3. n [Option ID = 136774]
4. n+1 [Option ID = 136775]
51) If A, B and C, three sets of values of x, are given as A: 2,3,7,1,3 2,3; B: 7,5,9,12,5,3,8; and C: 4,4,11,7,2,3,4.
Which of the followings is true?
[Question ID = 18570][Question Description = M.A_ECOM_Q_051]
1. Mean of A=Mode of C
[Option ID = 136776]
2. Mean of C=Median of B
[Option ID = 136777]
3. Median of B=Mode of A
[Option ID = 136778]
Page 9
[Option ID = 136779]
52) The variance of 15 observations is 4. If each observation is increased by 9, the variance of
resulting observations is
[Question ID = 18571][Question Description = M.A_ECOM_Q_052]
1. 2 [Option ID = 136780]
2. 5 [Option ID = 136781]
3. 4 [Option ID = 136782]
4. 7 [Option ID = 136783]
53) Mean deviation is minimum when taken from [Question ID = 18572][Question Description = M.A_ECOM_Q_053]
1. Mean [Option ID = 136784]
2. Median [Option ID = 136785]
3. Mode [Option ID = 136786]
4. Impossible to know [Option ID = 136787]
54) For a distribution, the coefficient of variation is 22% and the value of arithmetic average is 7. The value of standard
deviation is
[Question ID = 18573][Question Description = M.A_ECOM_Q_054]
1. 1.44
[Option ID = 136788]
2. 1.54
[Option ID = 136789]
3. 0.54
[Option ID = 136790]
4. 154
[Option ID = 136791]
55) We are given the following information, mean 3.28, mode 3 and standard deviation 1.34. The Karl Pearson’s Co‐
efficient of Skewness is
[Question ID = 18574][Question Description = M.A_ECOM_Q_055]
1. 0.21
[Option ID = 136792]
2. 0.41
[Option ID = 136793]
3. 1.41
[Option ID = 136794]
4. 4.11
[Option ID = 136795]
56) From the given information: number of observation (n) = 16, correlation co‐efficient (r) = 0.9544, the Probable Error
(PE) is given by
[Question ID = 18575][Question Description = M.A_ECOM_Q_056]
1. 1.213
[Option ID = 136796]
2. 0.015
[Option ID = 136797]
3. 1.321
[Option ID = 136798]
4. 0.123
[Option ID = 136799]
57) The Fisher’s Price Index is the …………….of Laspeyre’s and Paasche’s price index numbers.
[Question ID = 18576][Question Description = M.A_ECOM_Q_057]
1. Arithmetic Mean
[Option ID = 136800]
2. Geometric Mean
[Option ID = 136801]
3. Harmonic Mean
[Option ID = 136802]
4. Corresponding
[Option ID = 136803]
Page 10
value A
[Question ID = 18592][Question Description = M.A_ECOM_Q_058]
1.
[Option ID = 136936]
2.
[Option ID = 136937]
3.
[Option ID = 136938]
4.
[Option ID = 136939]
59) A linear regression model is [Question ID = 18577][Question Description = M.A_ECOM_Q_059]
1. Linear in parameters and may not be linear in variables [Option ID = 136804]
2. Non‐linear in parameters and may not be linear in variables [Option ID = 136805]
3. Linear in explanatory variables and may not be linear in parameters [Option ID = 136806]
4. Linear in parameters and must be linear in variables [Option ID = 136807]
60)
[Question ID = 18593][Question Description = M.A_ECOM_Q_060]
1. Positive values [Option ID = 136940]
2. Equal to zero [Option ID = 136941]
3. Negative values [Option ID = 136942]
4. 5 [Option ID = 136943]
61) Homoscedasticity refers to the error term having [Question ID = 18578][Question Description = M.A_ECOM_Q_061]
1. Positive variance [Option ID = 136808]
2. Positive mean [Option ID = 136809]
3. Zero mean [Option ID = 136810]
4. Constant variance [Option ID = 136811]
62) What is the number of degrees of freedom for a simple bivariate linear regression with ‘n’
observations?
[Question ID = 18579][Question Description = M.A_ECOM_Q_062]
1. n [Option ID = 136812]
2. n‐1 [Option ID = 136813]
3. n‐2 [Option ID = 136814]
4. 2 [Option ID = 136815]
63) Accepting a false null hypothesis results in the type of error is
[Question ID = 18580][Question Description = M.A_ECOM_Q_063]
1. Type I error
[Option ID = 136816]
2. Type II error
[Option ID = 136817]
3. Hypothesis error
[Option ID = 136818]
4. Structural error
[Option ID = 136819]
64)
[Question ID = 18594][Question Description = M.A_ECOM_Q_064]
1. One sided hypothesis test [Option ID = 136944]
2. Two sided hypothesis test [Option ID = 136945]
3. Open ended hypothesis test [Option ID = 136946]
Page 11
65) When comparing r2 of two regression models, the model should have same
[Question ID = 18581][Question Description = M.A_ECOM_Q_065]
1. Error term
[Option ID = 136820]
2. Explanatory variables
[Option ID = 136821]
3. Explained variables
[Option ID = 136822]
4. Explanatory variables and Explained variables both
[Option ID = 136823]
66) Multiple co‐efficient of determination (R2) measures the [Question ID = 17639][Question Description =
M.A_ECOM_Q_066]
1. Homoscedasticity of multiple regression model [Option ID = 136824]
2. Multicollinearity of multiple regression model [Option ID = 136825]
3. Heteroscedasticity of multiple regression model [Option ID = 136826]
4. Goodness of fit of multiple regression model [Option ID = 136827]
67) If a quantitative variable has ‘m’ categories, we can introduce [Question ID = 17640][Question Description =
M.A_ECOM_Q_067]
1. m+1 dummy variables [Option ID = 136828]
2. m dummy variables [Option ID = 136829]
3. m‐1 dummy variables [Option ID = 136830]
4. m+2 dummy variables [Option ID = 136831]
68) If e> 1, the total revenue curve has a …………..slope. [Question ID = 17641][Question Description = M.A_ECOM_Q_068]
1. Positive [Option ID = 136832]
2. Negative [Option ID = 136833]
3. Zero [Option ID = 136834]
4. None of the above [Option ID = 136835]
69) Kinked isoquant reflects
[Question ID = 17642][Question Description = M.A_ECOM_Q_069]
1. Strict complementarity between L (labour) and K (capital)
[Option ID = 136836]
2. Continuous substitutability of K and L
[Option ID = 136837]
3. Perfect substitutability of K and L
[Option ID = 136838]
4. Limited substitutability of K and L
[Option ID = 136839]
70) What is the relationship between average propensity to consume (APC) and marginal propensity to consume (MPS)?
[Question ID = 17643][Question Description = M.A_ECOM_Q_070]
1. APC is equal to MPC at all levels of income
[Option ID = 136840]
2. APC is greater than MPC at all levels of income
[Option ID = 136841]
3. APC is smaller than MPC at all levels of income
[Option ID = 136842]
4. MRT is greater
[Option ID = 136843]
71) Which hypothesis states that people gear their consumption behaviour to their long term consumption opportunities and
not their current level of income?
[Question ID = 17644][Question Description = M.A_ECOM_Q_071]
1. Life cycle consumption hypothesis
[Option ID = 136844]
2. Permanent consumption hypothesis
[Option ID = 136845]
3. Relative consumption hypothesis
[Option ID = 136846]
Page 12
[Option ID = 136847]
72)
[Question ID = 18595][Question Description = M.A_ECOM_Q_072]
1. Hold I and II [Option ID = 136948]
2. Hold I and III [Option ID = 136949]
3. Hold only I [Option ID = 136950]
4. Hold I,II and III [Option ID = 136951]
73)
[Question ID = 18596][Question Description = M.A_ECOM_Q_073]
1. Hold I and II
[Option ID = 136952]
2. Hold II and III
[Option ID = 136953]
3. Hold only I
[Option ID = 136954]
4. Hold I, II and III.
[Option ID = 136955]
74)
[Question ID = 18597][Question Description = M.A_ECOM_Q_074]
1.
[Option ID = 136956]
2.
[Option ID = 136957]
3.
[Option ID = 136958]
4.
[Option ID = 136959]
75) What is not true about the systematic review (SR)?
[Question ID = 17645][Question Description = M.A_ECOM_Q_075]
1. SR is based on scientific
[Option ID = 136848]
2. SR is based on logical
[Option ID = 136849]
3. SR has a process
[Option ID = 136850]
Page 13
[Option ID = 136851]
76) While accessing and using the internet stuff, which of these steps is the most essential? [Question ID = 17646][Question
Description = M.A_ECOM_Q_076]
1. Recording the full URL [Option ID = 136852]
2. Noting the access dates [Option ID = 136853]
3. Downloading material to be referenced [Option ID = 136854]
4. They are all equally important [Option ID = 136855]
77) Which of the following statements about plagiarism is most important and appropriate? [Question ID = 17647][Question
Description = M.A_ECOM_Q_077]
1. It is so easy to "copy and paste" from the internet that everyone does it nowadays. If a proper reference is given, where is the harm in that?
[Option ID = 136856]
2. How can we say for sure where our own ideas come from exactly? If we tried to give a reference for everything we could never hope to succeed.
[Option ID = 136857]
3. Any suggestion that we have written what another actually wrote is morally wrong. The whole point of a literature review is to show what we have
read and what we thought about it. [Option ID = 136858]
4. Plagiarism is such an awful crime that those found guilty should be obliged to wear a scarlet "P" on their clothing. [Option ID = 136859]
78) The p‐value and significance in research papers is sufficient to assess the relation between two variables?
[Question ID = 17648][Question Description = M.A_ECOM_Q_078]
1. False
[Option ID = 136860]
2. True
[Option ID = 136861]
3. Not enough information
[Option ID = 136862]
4. Minimising law
[Option ID = 136863]
79) What is important to include a list of references like works cited bibliography, references at the end of the article and
report.
[Question ID = 17649][Question Description = M.A_ECOM_Q_079]
1. A reader can check the accuracy of information by reviewing the references from the references list.
[Option ID = 136864]
2. If researcher interested further in the topic, a reader can locate the refrences information from your list for further reading
[Option ID = 136865]
3. It will build researcher credibility as good write and scholar.
[Option ID = 136866]
4. Constant law
[Option ID = 136867]
80) Which command allows researcher to set the required journal format in LaTeX?
[Question ID = 17650][Question Description = M.A_ECOM_Q_080]
1. \document{}
[Option ID = 136868]
2. \documentclass{}
[Option ID = 136869]
3. \format{}
[Option ID = 136870]
4. \documentformat{}
[Option ID = 136871]
81) Zotero is a tool for [Question ID = 17651][Question Description = M.A_ECOM_Q_081]
1. Statistical analysis software [Option ID = 136872]
2. Plagiarism check software’s [Option ID = 136873]
3. Reference management [Option ID = 136874]
4. Grammar checking [Option ID = 136875]
82) What do you consider before submission of your article to a journal for publication?[Question ID = 17652][Question
Description = M.A_ECOM_Q_082]
1. Indexing of the journal [Option ID = 136876]
2. Scope of journal [Option ID = 136877]
3. Alignment of researcher article with already published article in the journal. [Option ID = 136878]
4. Game theory [Option ID = 136879]
Page 14
[Question ID = 17653][Question Description = M.A_ECOM_Q_083]
1. Yes, variable can define
[Option ID = 136880]
2. No, variable cant defines
[Option ID = 136881]
3. Variables are not important in the research
[Option ID = 136882]
4. Yes and no
[Option ID = 136883]
84)
[Question ID = 20774][Question Description = M.A_ECOM_Q_084 ]
1. Reject it at 5% level of significant
[Option ID = 148729]
2. Reject at 1% level of significant
[Option ID = 148730]
3. Accept it at 5% level of significant
[Option ID = 148731]
4. Accept at 1% level of significant
[Option ID = 148732]
85)
[Question ID = 20775][Question Description = M.A_ECOM_Q_085 ]
1.
[Option ID = 148733]
2.
[Option ID = 148734]
3.
[Option ID = 148735]
4.
[Option ID = 148736]
86)
[Question ID = 20776][Question Description = M.A_ECOM_Q_086 ]
1. Wilcoxon rank sum test
[Option ID = 148737]
2. Wilcoxon sign rank test
[Option ID = 148738]
3. Kruskal wallis test
[Option ID = 148739]
4. Wilson
Page 15
87) The lines of regression intersect at point
[Question ID = 17654][Question Description = M.A_ECOM_Q_087]
1. (X ̄ ,Ȳ)
[Option ID = 136884]
2. (x, y)
[Option ID = 136885]
3. (0, 0)
[Option ID = 136886]
4. (1, 1)
[Option ID = 136887]
88) During the regression analysis, researcher found that one regression coefficient of the two‐regression
line is greater than 1, the other will be
[Question ID = 17655][Question Description = M.A_ECOM_Q_088]
1. >1
[Option ID = 136888]
2. 1
[Option ID = 136889]
3. <1
[Option ID = 136890]
4. 0
[Option ID = 136891]
89) Given below are two statements for time series
I The component of time series attached to long term variation is secular trend
II The component of time series attached to short term variation is seasonal trend
[Question ID = 17656][Question Description = M.A_ECOM_Q_089]
1. Statement I is true and Statement II is false
[Option ID = 136892]
2. Statement I is false and Statement II is true
[Option ID = 136893]
3. Both Statement I and Statement II are true
[Option ID = 136894]
4. Both Statement I and Statement II are false
[Option ID = 136895]
90) Match the following lists and select the correct answer from codes below:
List ‐ I List – II
(A) Crosstabulation (i) Stationarity
(B) Unit root test (ii) Causality
(C) F test (iii) X2 test
(D) Granger test (iv) Comparison of several means
Code: (A) (B) (C) (D)
[Question ID = 18582][Question Description = M.A_ECOM_Q_090]
1. (iii) (i) (iv) (ii) [Option ID = 136896]
2. (i) (ii) (iii) (iv) [Option ID = 136897]
3. (iv) (iii) (ii) (i) [Option ID = 136898]
4. (ii) (iii) (i) (iv) [Option ID = 136899]
91) Match the following lists and select the correct answer from codes below:
List ‐ I List – II
(A) Crosstabulation (i) Stationarity
(B) Unit root test (ii) Causality
(C) F test (iii) χ2 test
(D) Granger test (iv) Comparison of several means
Page 16
1. A‐iii, B‐i, C‐iv, D‐ii
[Option ID = 148725]
2. A‐i, B‐ii, C‐iii, D‐iv
[Option ID = 148726]
3. A‐iv, B‐iii, C‐ii, D‐i
[Option ID = 148727]
4. A‐ii, B‐iii, Ci, D‐iv
[Option ID = 148728]
92) To the right of IS (Goods Market Equilibrium) and left of LM (Money Market Equilibrium)
there is
[Question ID = 18583][Question Description = M.A_ECOM_Q_092]
1. Excess supply of money and excess supply of goods [Option ID = 136900]
2. Excess supply of money and excess demand of goods [Option ID = 136901]
3. Excess demand of money and excess supply of goods [Option ID = 136902]
4. Excess demand of money and excess demand of goods [Option ID = 136903]
93) If the aggregate currency with the public reduces and total demand deposits increase by exactly the same amount, the
aggregate money supply in the economy would
[Question ID = 18584][Question Description = M.A_ECOM_Q_093]
1. Go up
[Option ID = 136904]
2. Come down
[Option ID = 136905]
3. Remain unchanged
[Option ID = 136906]
4. Go up and come down
[Option ID = 136907]
94) In a world with only three countries (A, B and C), if countries A and B have trade surpluses, then which of the
following can be said (assume exports and imports are both valued fob)?
[Question ID = 18585][Question Description = M.A_ECOM_Q_094]
1. C must necessarily have a current account deficit
[Option ID = 136908]
2. C’s trade is balanced
[Option ID = 136909]
3. If C has a current account surplus, it must necessarily have a surplus in its invisibles balance
[Option ID = 136910]
4. C could also have a trade surplus
[Option ID = 136911]
95) Which one of the following statements is necessarily true?[Question ID = 18586][Question Description =
M.A_ECOM_Q_095]
1. A monopolist always operates on the inelastic portion of the demand curve it faces. [Option ID = 136912]
2. If a monopolist can charge different prices in two different markets, then it would tend to charge the lower price in the market with the less elastic
demand. [Option ID = 136913]
3. The level of output produced by a perfectly price‐discriminating monopolist is efficient. [Option ID = 136914]
4. None of the above [Option ID = 136915]
96) In a closed economy with unutilized capacity, if the investment rate remains unchanged and savings amount to 20
percent of GDP, an increase in the government's fiscal deficit by 100 units will cause economic activity to increase by
[Question ID = 18587][Question Description = M.A_ECOM_Q_096]
1. 100 units
[Option ID = 136916]
2. 120 units
[Option ID = 136917]
3. 200 units
[Option ID = 136918]
4. 500 units
[Option ID = 136919]
97) A consumer's preference over commodities 1 and 2 can be represented by the utility function
U (x1, x 2) ~ x 1 + x 2. Suppose the price of commodity 1 changes. Which of the following
Page 17
[Question ID = 18588][Question Description = M.A_ECOM_Q_097]
1. There is no income effect on the demand for commodity I. [Option ID = 136920]
2. There is no substitution effect on the demand for commodity I. [Option ID = 136921]
3. There is no substitution effect on the demand for commodity 1 if the cheaper good remains cheaper after the price change. [Option ID = 136922]
4. There is no income effect on the demand for commodity 1 if the cheaper good remains cheaper after the price change. [Option ID = 136923]
98) The standard deviation calculated from two values X1 and X2 of a variable X is equal to
[Question ID = 18589][Question Description = M.A_ECOM_Q_098]
1. 1/3r d of their difference
[Option ID = 136924]
2. ½ of their difference
[Option ID = 136925]
3. Square root of their difference
[Option ID = 136926]
4. ¼ of their difference
[Option ID = 136927]
99) A frequency distribution gives the following results:
(i) coefficient of variation = 5,
(ii) variance= 4,
(iii) skewness = 0.5,
what are the mean and mode of the distribution?
[Question ID = 18590][Question Description = M.A_ECOM_Q_099]
1. 40 and 39
[Option ID = 136928]
2. 39 and 40
[Option ID = 136929]
3. 45 and 40
[Option ID = 136930]
4. 40 and 35
[Option ID = 136931]
100) What is not true about correlation coefficient?[Question ID = 18591][Question Description = M.A_ECOM_Q_100]
1. The correlation coefficient r is independent of the choice of origin and scale. [Option ID = 136932]
2. The correlation coefficient r is a pure number and is not independent of the units of measurement. [Option ID = 136933]
3. The correlation coefficient lies between ‐1 and +1. [Option ID = 136934]
4. The correlation coefficient can be 0.3 [Option ID = 136935]
Document Details
| Board / Org | NTA |
| Exam | Jawaharlal Nehru University Entrance Examination |
| Type | Question Paper |
| Pages | 17 |
| Updated | 09 Jun 2026 |