JNUEE 2021 Question Paper Ph.D Economics Studies N Planning
Finished viewing? Save it for later —
Download JNUEE 2021 Question Paper Ph.D Economics Studies N Planning (PDF · 16 pages)About JNUEE 2021 Question Paper Ph.D Economics Studies N Planning
JNUEE 2021 Question Paper Ph.D Economics Studies N Planning is available here for free download. Published by NTA for JNUEE, this question paper can be viewed online or downloaded as a PDF (16 pages). Candidates preparing for JNUEE can use JNUEE 2021 Question Paper Ph.D Economics Studies N Planning to understand the exam pattern, the type of questions asked, and the overall difficulty level.
Frequently Asked Questions
How can I download JNUEE 2021 Question Paper Ph.D Economics Studies N Planning?
Open this page and click the Download button to save JNUEE 2021 Question Paper Ph.D Economics Studies N Planning as a PDF. It is completely free on AglaSem Docs.
Is JNUEE 2021 Question Paper Ph.D Economics Studies N Planning free to download?
Yes. JNUEE 2021 Question Paper Ph.D Economics Studies N Planning can be viewed online and downloaded as a PDF free of cost on AglaSem Docs.
How many pages does JNUEE 2021 Question Paper Ph.D Economics Studies N Planning have?
JNUEE 2021 Question Paper Ph.D Economics Studies N Planning contains 16 pages, which you can read online or download together as a single PDF.
Where can I find more JNUEE study material?
You can find more JNUEE question papers, sample papers, syllabus, and answer keys on AglaSem Docs.
JNUEE 2021 Question Paper Ph.D Economics Studies N Planning – Text
Read the full text of this question paper below — useful to quickly search, copy and reference the content online without downloading the PDF.
📄 View text version (16 pages)
Page 1
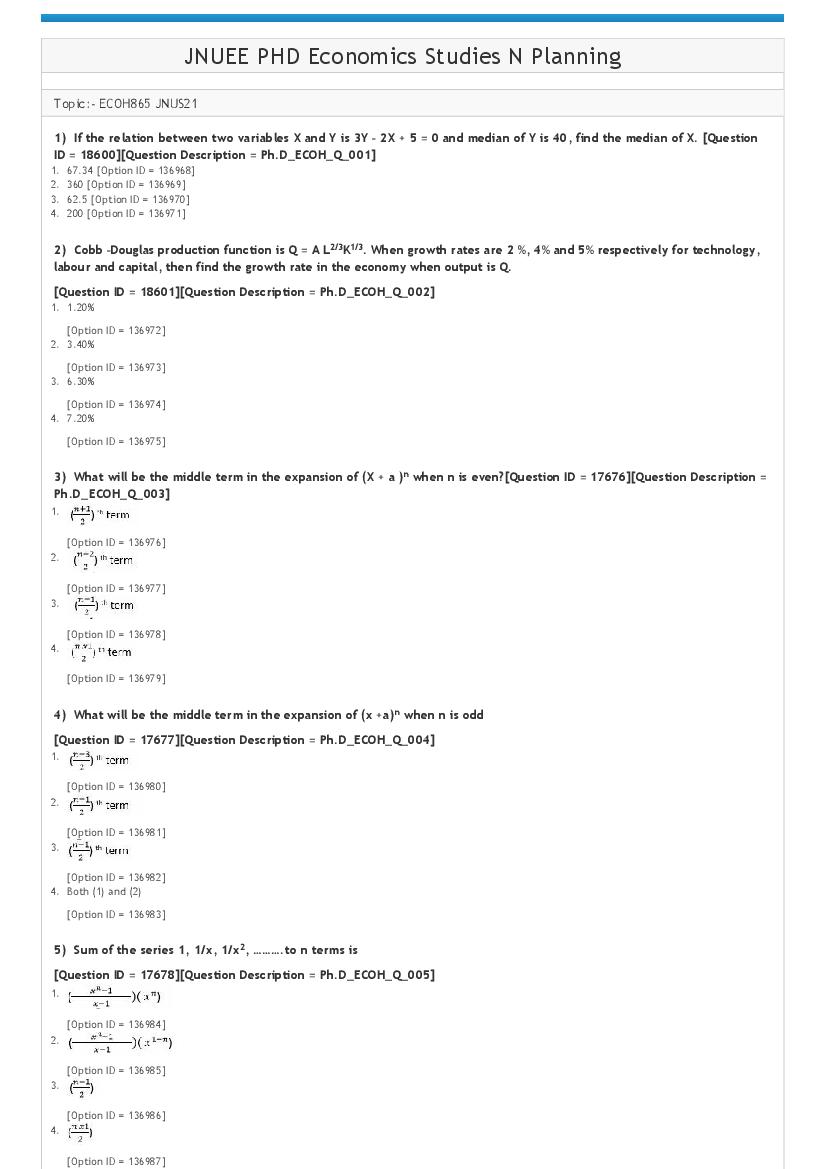
Topic:‐ ECOH865 JNUS21
1) If the relation between two variables X and Y is 3Y – 2X + 5 = 0 and median of Y is 40, find the median of X. [Question
ID = 18600][Question Description = Ph.D_ECOH_Q_001]
1. 67.34 [Option ID = 136968]
2. 360 [Option ID = 136969]
3. 62.5 [Option ID = 136970]
4. 200 [Option ID = 136971]
2) Cobb –Douglas production function is Q = A L2/3K1/3. When growth rates are 2 %, 4% and 5% respectively for technology,
labour and capital, then find the growth rate in the economy when output is Q.
[Question ID = 18601][Question Description = Ph.D_ECOH_Q_002]
1. 1.20%
[Option ID = 136972]
2. 3.40%
[Option ID = 136973]
3. 6.30%
[Option ID = 136974]
4. 7.20%
[Option ID = 136975]
3) What will be the middle term in the expansion of (X + a )n when n is even?[Question ID = 17676][Question Description =
Ph.D_ECOH_Q_003]
1.
[Option ID = 136976]
2.
[Option ID = 136977]
3.
[Option ID = 136978]
4.
[Option ID = 136979]
4) What will be the middle term in the expansion of (x +a)n when n is odd
[Question ID = 17677][Question Description = Ph.D_ECOH_Q_004]
1.
[Option ID = 136980]
2.
[Option ID = 136981]
3.
[Option ID = 136982]
4. Both (1) and (2)
[Option ID = 136983]
5) Sum of the series 1, 1/x, 1/x2, ……….to n terms is
[Question ID = 17678][Question Description = Ph.D_ECOH_Q_005]
1.
[Option ID = 136984]
2.
[Option ID = 136985]
3.
[Option ID = 136986]
4.
[Option ID = 136987]
Page 2
Ph.D_ECOH_Q_006]
1. 23 [Option ID = 136988]
2. 14.6 [Option ID = 136989]
3. 8 [Option ID = 136990]
4. 12.5 [Option ID = 136991]
7) Find the income (Y) when investment (I) and propensity to save (S) are given as I = 0.2Y and S = 0.4Y ‐ 50[Question ID
= 17680][Question Description = Ph.D_ECOH_Q_007]
1. 250 [Option ID = 136992]
2. 650 [Option ID = 136993]
3. 423 [Option ID = 136994]
4. 657 [Option ID = 136995]
8) When the price of 1 unit of wheat and rice is Rs. 15 and Rs. 20 respectively. Production of 1 unit of wheat requires 2
units of labour and 3 units of capital. Production of rice requires 3 units of labour and 6 units of capital. Find wage (w) and
interest (r).[Question ID = 17681][Question Description = Ph.D_ECOH_Q_008]
1. W = 10, r= 5/3 [Option ID = 136996]
2. W = 20, r= 5/3 [Option ID = 136997]
3. W = 30, r= 5/3 [Option ID = 136998]
4. W = 10, r= 7/3 [Option ID = 136999]
9) When the demand for fish (X) in a city is X= 60 – 6P. Terrorist attacked the city and hence the demand for fish became
free good. What will be the demand for fish?
[Question ID = 17682][Question Description = Ph.D_ECOH_Q_009]
1. 48
[Option ID = 137000]
2. 103
[Option ID = 137001]
3. 60
[Option ID = 137002]
4. 66
[Option ID = 137003]
10) A farmer has 1.3 Acre of land on which he cultivates 2 times in a year (2020). What is Net Sown Area in this case?
[Question ID = 17683][Question Description = Ph.D_ECOH_Q_010]
1. 1.3 acres
[Option ID = 137004]
2. 2.6 acres
[Option ID = 137005]
3. 3.9 acres
[Option ID = 137006]
4. 11.3 acres
[Option ID = 137007]
11) If the relation between two variables X and Y is 2Y – 6X =6 and mode of Y is 21, find the mode of X. [Question ID =
17684][Question Description = Ph.D_ECOH_Q_011]
1. 6 [Option ID = 137008]
2. 4 [Option ID = 137009]
3. 2 [Option ID = 137010]
4. None [Option ID = 137011]
12) A farmer has 12 acres of land on which he crops paddy on 10 acres, wheat on 12 acres and lentils on 8 acres in a year.
What will be cropping intensity?[Question ID = 17685][Question Description = Ph.D_ECOH_Q_012]
1. 250% [Option ID = 137012]
2. 340% [Option ID = 137013]
3. 452% [Option ID = 137014]
4. 762% [Option ID = 137015]
13) Suppose you have two options either to go to movie or to work to earn. In both cases time spent is 6 hours. You are
willing to spend Rs. 500 for movie for which you spent Rs. 300 for ticket. If you work and get Rs. 70 per hour. What will be
opportunity cost of watching the movie?
[Question ID = 17686][Question Description = Ph.D_ECOH_Q_013]
1. 720
[Option ID = 137016]
2. 420
Page 3
3. 678
[Option ID = 137018]
4. 902
[Option ID = 137019]
14) The budget for movie is Rs. 150 out of which you have to spend Rs. 75 for ticket. You have another option to go to
work to earn Rs. 80. Should you go for movie?
[Question ID = 17687][Question Description = Ph.D_ECOH_Q_014]
1. Yes
[Option ID = 137020]
2. No
[Option ID = 137021]
3. Can’t say
[Option ID = 137022]
4. 8
[Option ID = 137023]
15) The domestic demand function (D) of Olive oil in India is 2500 – 10P and Supply (S) function is 1000 + 5P. The
domestic demand (D) of Olive oil in France is 2000‐15P and domestic supply (S) = 3000 + 5P. What will be the price of
Olive oil when India imports from France?
[Question ID = 17688][Question Description = Ph.D_ECOH_Q_015]
1. 14.28
[Option ID = 137024]
2. 16.89
[Option ID = 137025]
3. 12
[Option ID = 137026]
4. 16
[Option ID = 137027]
16) The domestic demand function (D) of Olive oil in India is 2500 – 10P and Supply (S) function is 1000 + 5P. The
domestic demand (D) of Olive oil in Iran is 2000‐15P and domestic supply (S) = 3000 + 5P. When India completely bans the
import from Iran to encourage domestic production, what will be the price of Olive oil?
[Question ID = 17689][Question Description = Ph.D_ECOH_Q_016]
1. 100
[Option ID = 137028]
2. 200
[Option ID = 137029]
3. 300
[Option ID = 137030]
4. 342
[Option ID = 137031]
17) Suppose India imports Lentils from USA at the price (P) of $ 10 per kg. The domestic demand is (D) =500 ‐10P and
domestic supply is (S) = 300 + 6P. What will be the effect of fixing import quota of 40 kg on price?
[Question ID = 17690][Question Description = Ph.D_ECOH_Q_017]
1. No change in price
[Option ID = 137032]
2. Price will increase by $4 /kg
[Option ID = 137033]
3. Price will decrease by $8 /kg
[Option ID = 137034]
4. Price will increase by $8 /kg
[Option ID = 137035]
18) When the demand function for two commodities are X1 = P1 ‐1.7 P2 0.8 and X2 = P1 0.5 P2 ‐0.2 then find Cross Partial
elasticity of demand for X2 with respect to price P1.
[Question ID = 17691][Question Description = Ph.D_ECOH_Q_018]
1. 0.7
[Option ID = 137036]
2. 0.8
Page 4
3. 0.5
[Option ID = 137038]
4. 0.4
[Option ID = 137039]
19) When MPC = 1/3, MRT (Marginal rate of tax) = 9/12 and change in the government expenditure (ΔG) =2, find the
increase in tax? [Question ID = 17692][Question Description = Ph.D_ECOH_Q_019]
1. 9/4 [Option ID = 137040]
2. 7/4 [Option ID = 137041]
3. 3/2 [Option ID = 137042]
4. 7 [Option ID = 137043]
20) When marginal propensity to consume out of disposable income MPCd =1/3, find the impact of the budget deficit of Rs.
1 on consumption.
[Question ID = 17693][Question Description = Ph.D_ECOH_Q_020]
1. 1/ 2
[Option ID = 137044]
2. 2/3
[Option ID = 137045]
3. 3/5
[Option ID = 137046]
4. 8
[Option ID = 137047]
21) Find budget deficit when marginal rate of tax MRT =3/5, change in the government expenditure (ΔG) =2, and MPC =
2/3.
[Question ID = 20820][Question Description = Ph.D_ECOH_Q_021]
1. ‐8/5
[Option ID = 137048]
2. 1/6
[Option ID = 137049]
3. ‐1/4
[Option ID = 137050]
4. 1/7
[Option ID = 137051]
22) When L=K=20, find marginal product of labour when production function is Y = 10 L2 + 3 KL[Question ID = 20821]
[Question Description = Ph.D_ECOH_Q_022]
1. 1/4 [Option ID = 137052]
2. 460 [Option ID = 137053]
3. 560 [Option ID = 137054]
4. 0 [Option ID = 137055]
23) When MPCd =1/6, MPC = 2/5, find tax multiplier.[Question ID = 20822][Question Description = Ph.D_ECOH_Q_023]
1. 5/18 [Option ID = 137056]
2. 2/15 [Option ID = 137057]
3. 1/71 [Option ID = 137058]
4. 1/17 [Option ID = 137059]
24) A Matrix of m rows and n Columns is …………………………… matrix[Question ID = 20823][Question Description =
Ph.D_ECOH_Q_024]
1. m +n [Option ID = 137060]
2. m ‐ n [Option ID = 137061]
3. m x n [Option ID = 137062]
4. m/n [Option ID = 137063]
25) A matrix is said to be a zero matrix if and only if ………………………………. of its elements is zero
[Question ID = 20824][Question Description = Ph.D_ECOH_Q_025]
1. each
[Option ID = 137064]
2. 1
[Option ID = 137065]
3. 2
[Option ID = 137066]
4. 7
Page 5
26) Transpose of transpose (A’)’ of a matrix (A) will be equal to …………………………..[Question ID = 20825][Question
Description = Ph.D_ECOH_Q_026]
1. (A) ‐ (A’)’ [Option ID = 137068]
2. (A) + (A’)’ [Option ID = 137069]
3. (A) [Option ID = 137070]
4. (A) X (A’)’ [Option ID = 137071]
27) When average tax rate (ATR) = 1/2, Marginal rate of tax (MRT)=1/5, what type of tax is it?
[Question ID = 20826][Question Description = Ph.D_ECOH_Q_027]
1. Regressive
[Option ID = 137072]
2. Progressive
[Option ID = 137073]
3. Both
[Option ID = 137074]
4. 7
[Option ID = 137075]
28) When Lorenz function f(X) = X2.3, find Gini coefficient.[Question ID = 20827][Question Description =
Ph.D_ECOH_Q_028]
1. 39.39 [Option ID = 137076]
2. 56.18 [Option ID = 137077]
3. 23.18 [Option ID = 137078]
4. 11.11 [Option ID = 137079]
29) When MC= 10 + 0.3X, MR=30 – 0.7X, damage borne by society in the externality is 10, find the dead weight loss
(DWL). [Question ID = 19774][Question Description = Ph.D_ECOH_Q_029]
1. 50 [Option ID = 137364]
2. 60 [Option ID = 137365]
3. 40 [Option ID = 137366]
4. 80 [Option ID = 137367]
30) When MC= 10 + 0.3X, MR=30 – 0.7X, damage borne by society in externality is 10, find the government revenue when
she interferes the externality. [Question ID = 20828][Question Description = Ph.D_ECOH_Q_030]
1. 100 [Option ID = 137080]
2. 200 [Option ID = 137081]
3. 300 [Option ID = 137082]
4. 400 [Option ID = 137083]
31) When MC= 10 + 0.3X, MR=30 – 0.7X, damage borne by society in externality is 10, find the consumer loss when the
government interferes the externality.[Question ID = 20829][Question Description = Ph.D_ECOH_Q_031]
1. 105 [Option ID = 137084]
2. 200 [Option ID = 137085]
3. 300 [Option ID = 137086]
4. 400 [Option ID = 137087]
32) When MC= 10 + 0.3X, MR=30 – 0.7X, damage borne by society in externality is 10, find the producer loss when the
government interferes the externality. [Question ID = 20830][Question Description = Ph.D_ECOH_Q_032]
1. 45 [Option ID = 137088]
2. 200 [Option ID = 137089]
3. 300 [Option ID = 137090]
4. 700 [Option ID = 137091]
33)
[Question ID = 20831][Question Description = Ph.D_ECOH_Q_033]
1. 4/5X1/3 [Option ID = 137092]
2. 4/3 X1/3 [Option ID = 137093]
3. 3/4 X1/3 [Option ID = 137094]
4. 7 [Option ID = 137095]
34) Find point elasticity at p=8 for demand function X = 25 – 4P + P2[Question ID = 20832][Question Description =
Ph.D_ECOH_Q_034]
1. 1.92 [Option ID = 137096]
2. 3.06 [Option ID = 137097]
3. 1.68 [Option ID = 137098]
4. 8.02 [Option ID = 137099]
Page 6
20833][Question Description = Ph.D_ECOH_Q_035]
1. 9/2 [Option ID = 137100]
2. 2/9 [Option ID = 137101]
3. 3/7 [Option ID = 137102]
4. 7/3 [Option ID = 137103]
36) When demand for X = 150 ‐15P, what will be the effect of price change from Rs. 4 to Rs. 5 on ed ( elasticity).
[Question ID = 20834][Question Description = Ph.D_ECOH_Q_036]
1. ed moves to zero [Option ID = 137104]
2. ed moves to infinity [Option ID = 137105]
3. no change [Option ID = 137106]
4. ed moves to unity [Option ID = 137107]
37) Saksham , a monopolist, produces computer (X) for which the cost ( C) = 4X and the demand for X in the market is P=
20 – 4X. After Corona, the government of India imposes VAT of 20.00 % to generate revenue. How much revenue does the
government generate?
[Question ID = 20835][Question Description = Ph.D_ECOH_Q_037]
1. 75/17
[Option ID = 137108]
2. 75/16
[Option ID = 137109]
3. 3/7
[Option ID = 137110]
4. 4/9
[Option ID = 137111]
38) What is one of the main results for the low female participation in the labour market?
[Question ID = 20836][Question Description = Ph.D_ECOH_Q_038]
1. Females spend relatively more time in unpaid domestic and care giving activities as compared to employment related activities.
[Option ID = 137112]
2. Females spend relatively more time in paid domestic and care giving activities.
[Option ID = 137113]
3. Females prefer to do domestic work in home.
[Option ID = 137114]
4. Employers do not want to give employment to females.
[Option ID = 137115]
39) The scheme of "Garib Kalyan Rozgar Abhiyan" was started by the Govt. of India in order
[Question ID = 20837][Question Description = Ph.D_ECOH_Q_039]
1. To mitigate the effects of COVID‐19 and to give employment to industrial workers.
[Option ID = 137116]
2. To give employment in rural area.
[Option ID = 137117]
3. To give employment to the urban poor.
[Option ID = 137118]
4. To mitigate the effects of COVID‐19 and to give employment to migrant workers in the destinations States.
[Option ID = 137119]
40) What is the Expenditure by General Government (Combined Centre and States) on Education and Health in the budget
of the year 2019‐20 (RE) as percentage to GDP? [Question ID = 20838][Question Description = Ph.D_ECOH_Q_040]
1. 2019‐20 ‐ Education: 1.5, Health: 3.0 [Option ID = 137120]
2. 2019‐20 ‐ Education: 3.0, Health: 3.5 [Option ID = 137121]
3. 2019‐20 ‐ Education: 3.0, Health: 1.5 [Option ID = 137122]
4. 2019‐20 ‐ Education: 2.0, Health: 3.5 [Option ID = 137123]
41) A clarion call for "Atma Nirbhar Bharat" was announced to revive the economy and to address the pandemic. A special
economic and comprehensive package of Rs. 20 lakh crore was announced in May, 2020. How much per cent was this
package equivalent to India's GDP? [Question ID = 20839][Question Description = Ph.D_ECOH_Q_041]
1. 15 per cent [Option ID = 137124]
2. 20 per cent [Option ID = 137125]
3. 10 per cent [Option ID = 137126]
4. 5 per cent [Option ID = 137127]
42) According to UNDP Human Development Report 2020, what are the four sub‐components of Human Development Index
(HDI) value? [Question ID = 17694][Question Description = Ph.D_ECOH_Q_042]
Page 7
2. Life expectancy at birth, Expected years of schooling, Mean years of schooling, Gross National Income (GNI). [Option ID = 137129]
3. Life expectancy at birth, Expected years of schooling, Median years of schooling, Gross National Income (GNI) per capita. [Option ID = 137130]
4. Life expectancy at birth, Infant Mortality rate, Mean years of schooling, Gross National Income (GNI) per capita. [Option ID = 137131]
43) According to UNDP Human Development Report 2020, arrange the nation wise Average Annual HDI Growth Rate 2010‐
2019 (per cent) in descending order.
[Question ID = 17695][Question Description = Ph.D_ECOH_Q_043]
1. USA; Norway; India; Bangladesh
[Option ID = 137132]
2. Bangladesh; India; USA; Norway
[Option ID = 137133]
3. Bangladesh; India; Norway; USA
[Option ID = 137134]
4. India; Bangladesh; Norway; USA
[Option ID = 137135]
44) The "Samagra Shiksha", an overarching programme was launched in 2018‐19. This programme is related to
[Question ID = 17696][Question Description = Ph.D_ECOH_Q_044]
1. the pre‐school to post graduation.
[Option ID = 137136]
2. class first to Ph.D.
[Option ID = 137137]
3. the school education sector extending from class 1 to class 12.
[Option ID = 137138]
4. the school education sector extending from pre‐school to class 12.
[Option ID = 137139]
45) During the period of COVID‐19‐induced lockdown, the increasing role of the "gig" economy was evident with significant
growth of online retail business. As a result, the gig economy has been popular amongst the workers in India. The nature of
job contract for a gig worker is given below. Which of the following is not correct? [Question ID = 17697][Question
Description = Ph.D_ECOH_Q_045]
1. Their labour contract is usually shorter and more specific to the task or job assigned. [Option ID = 137140]
2. Their employment type might be either temporary or contractual and certainly not regular. [Option ID = 137141]
3. The nature of payment against the work is more of piece rate, negotiable, may be as wage or partly as profit/reward than a fixed salary. [Option ID
= 137142]
4. Most of the time the workers are not flexible to decide on when to work, where to work, etc. [Option ID = 137143]
46) The GDP growth rates (per cent) of years 2017‐18, 2018‐19, and 2019‐20 (Provisional Estimates) in India are given
below respectively. Which one of the following options is correct?
[Question ID = 17698][Question Description = Ph.D_ECOH_Q_046]
1. 2017‐18 : 7.0, 2018‐19 : 6.1, 2019‐20 : 4.2
[Option ID = 137144]
2. 2017‐18 : 5.0, 2018‐19 : 5.5, 2019‐20 : 3.0
[Option ID = 137145]
3. 2017‐18 : 5.0, 2018‐19 : 6.1, 2019‐20 : 8.2
[Option ID = 137146]
4. 2017‐18 : 9.0, 2018‐19 : 8.1, 2019‐20 : 7.2
[Option ID = 137147]
47) In the year 2020‐21, various measures have been taken by the central government to control inflation and to stabilize
prices of food items. Which of the following is not correct?
[Question ID = 17699][Question Description = Ph.D_ECOH_Q_047]
1. Banning the export of onion w.e.f. 14.09.2020, revoked w.e.f. 01.012021.
[Option ID = 137148]
2. Imposition of stock limit on onion under the EC Act w.e.f. 23.10.2020 to prevent hoarding, lapsed 31.12.2020.
[Option ID = 137149]
3. Easing of restrictions on imports, facilitating imports at integrated check‐posts, issuance of licenses for imports and reduction in import duties.
[Option ID = 137150]
4. Measures to decrease import of onion, tur dal and masur dal in the country that increase of prices.
[Option ID = 137151]
48) How much per cent of the total workforce in India is still engaged in agricultural and allied sector activities (Census
2011)? [Question ID = 17700][Question Description = Ph.D_ECOH_Q_048]
Page 8
2. 68.6 per cent [Option ID = 137153]
3. 65.6 per cent [Option ID = 137154]
4. 54.6 per cent [Option ID = 137155]
49) The share of Gross Value Added (GVA) of agricultural and allied sector in GVA of Total Economy (per cent) in the year
2017‐18 was 18.0 per cent (Second Revised Estimate) of India. Which of the following is correct share in the year 2018‐19
(First Revised Estimate) and 2019‐ 20 (Provisional Estimates)? [Question ID = 17701][Question Description =
Ph.D_ECOH_Q_049]
1. 2018‐19 : 17.1, 2019‐20: 17.8 [Option ID = 137156]
2. 2018‐19 : 19.1, 2019‐20: 20.8 [Option ID = 137157]
3. 2018‐19 : 21.1, 2019‐20: 22.8 [Option ID = 137158]
4. 2018‐19 : 16.1, 2019‐20: 15.8 [Option ID = 137159]
50) Growth of Gross Value Added of total economy and growth of Gross Value Added of Agriculture and Allied sector
respectively, for the year 2020‐21 (First Advance Estimates) of India are given below. Which of the following is correct?
[Question ID = 17702][Question Description = Ph.D_ECOH_Q_050]
1. ‐7.2 per cent, ‐3.4 per cent [Option ID = 137160]
2. ‐7.2 per cent, 3.4 per cent [Option ID = 137161]
3. 4.0 per cent, 3.5 per cent [Option ID = 137162]
4. ‐7.0 per cent, 7.4 per cent [Option ID = 137163]
51) The President gave his assent on September 27, 2020 to following three reforms related to agriculture sector. Match
the following and choose the correct answer.
(A) The Farmers' Produce Trade and Commerce (Promotion and Facilitation) Act, 2020
(B) The Farmer (Empowerment and Protection) Agreement of Price Assurance and Farm Services Act, 2020
(C) The Essential Commodities (Amendment) Act, 2020
(I) To provide framework on contract farming and sale of future farming produce at a mutually agreed remunerative price.
(II) To transact in agricultural commodities even outside notified APMC mandis and to promote efficient, transparent and
barrier‐free interstate and intra‐state trade.
(III) To remove some agricultural commodities from the list of essential commodities, except under extraordinary
circumstances.
(IV) To ban the entire sale and purchase of agricultural commodities in notified Agricultural Produce Marketing Committee
[Question ID = 17703][Question Description = Ph.D_ECOH_Q_051]
1. A : II, B : I, C : III
[Option ID = 137164]
2. A : III, B : I, C : II
[Option ID = 137165]
3. A : II, B : I, C : IV
[Option ID = 137166]
4. A : I, B : II, C : III
[Option ID = 137167]
52) The share of Gross Value Added (GVA) of service sector (excluding Construction) (in current prices) in GVA of Total
Economy (per cent) in the year 2020‐21 (Advance Estimates) was? [Question ID = 17704][Question Description =
Ph.D_ECOH_Q_052]
1. 44.3 [Option ID = 137168]
2. 64.3 [Option ID = 137169]
3. 54.3 [Option ID = 137170]
4. 34.3 [Option ID = 137171]
53) What is the Expenditure by General Government (Combined Centre and States) on Education and Health in the budget
of year 2019‐20 (RE) as percentage to total expenditure? [Question ID = 17705][Question Description = Ph.D_ECOH_Q_053]
1. 2019‐20 ‐ Education: 5.3, Health: 10.4 [Option ID = 137172]
2. 2019‐20 ‐ Education: 10.4, Health: 5.3 [Option ID = 137173]
3. 2019‐20 ‐ Education: 10.4, Health: 10.0 [Option ID = 137174]
4. 2019‐20 ‐ Education: 10.2, Health: 9.5 [Option ID = 137175]
54) Which of the following is not correct regarding two‐sided market?
[Question ID = 17706][Question Description = Ph.D_ECOH_Q_054]
1. Two sets of agents interact through an intermediary or platform.
[Option ID = 137176]
2. The decisions of each set of agents affect the outcomes of the other set of agents, typically through an externality.
[Option ID = 137177]
3. Digital technology enables two‐sided markets which saw the emergence of e‐commerce and online retailing platform such as Amazon, Flipkart, Ola,
Page 9
[Option ID = 137178]
4. Two‐sided market does not have any intermediary.
[Option ID = 137179]
55) Gig or platform workers were devoid of their basic rights and social security and they were also not entitled to legal
protections under labour laws. When have they been brought under the ambit of the labour laws?
[Question ID = 17707][Question Description = Ph.D_ECOH_Q_055]
1. 2018
[Option ID = 137180]
2. 2019
[Option ID = 137181]
3. 2015
[Option ID = 137182]
4. 2020
[Option ID = 137183]
56) Which of the following trend of the gross fiscal deficit as percentage of GDP is correct?
[Question ID = 17708][Question Description = Ph.D_ECOH_Q_056]
1. Year 2017‐18 : 3.5, Year 2018‐19: 3.4,
Year 2019‐20 (Provisional Actual): 4.6,
Year 2020‐21 (Budget Estimates) : 3.5
[Option ID = 137184]
2. Year 2017‐18 : 3.5, Year 2018‐19: 4.5,
Year 2019‐20 (Provisional Actual): 5.6,
Year 2020‐21 (Budget Estimates) : 6.5
[Option ID = 137185]
3. Year 2017‐18 : 3.5, Year 2018‐19: 3.1,
Year 2019‐20 (Provisional Actual): 2.9,
Year 2020‐21 (Budget Estimates) : 1.5
[Option ID = 137186]
4. Year 2017‐18 : 6.5, Year 2018‐19: 5.6,
Year 2019‐20 (Provisional Actual): 4.5,
Year 2020‐21 (Budget Estimates) : 3.5
[Option ID = 137187]
57) The percentage of persons of 15‐29 years who received formal vocational/technical training during 2017‐18 in India
is..... [Question ID = 17709][Question Description = Ph.D_ECOH_Q_057]
1. 5.5 per cent [Option ID = 137188]
2. 2.5 per cent [Option ID = 137189]
3. 7.5 per cent [Option ID = 137190]
4. 10.5 per cent [Option ID = 137191]
58) If elasticity of demand is equal to infinity (Ed=∞), the values of MR and AR will be
[Question ID = 17710][Question Description = Ph.D_ECOH_Q_058]
1. MR=AR, AR=MR
[Option ID = 137192]
2. MR>0, AR>0
[Option ID = 137193]
3. MR<0, AR>0
[Option ID = 137194]
4. AR/MR
[Option ID = 137195]
59) If the two goods are economic bad, the indifference curve will be
[Question ID = 17711][Question Description = Ph.D_ECOH_Q_059]
1. Convex to the origin
[Option ID = 137196]
2. Concave
[Option ID = 137197]
3. L shape
Page 10
4. Strait line
[Option ID = 137199]
60) In case of perfectly complementary good, the utility function U (x1, x2) will be
[Question ID = 19751][Question Description = Ph.D_ECOH_Q_060]
1. Min (ax1, bx2)
[Option ID = 137200]
2. ax1+bx2
[Option ID = 137201]
3. ax1/bx2
[Option ID = 137202]
4. ax
[Option ID = 137203]
61) What will happen if demand and supply curve both shift to the left by the same amount? [Question ID = 19752]
[Question Description = Ph.D_ECOH_Q_061]
1. Quantity decreases, price constant [Option ID = 137204]
2. Quantity increases, price decreases [Option ID = 137205]
3. Both increases [Option ID = 137206]
4. Both decreases [Option ID = 137207]
62) If production function is f (x1, x2) = x12, x22 it exhibits
[Question ID = 19753][Question Description = Ph.D_ECOH_Q_062]
1. Constant returns to scale
[Option ID = 137208]
2. Increasing returns to scale
[Option ID = 137209]
3. Decreasing returns to scale
[Option ID = 137210]
4. x
[Option ID = 137211]
63) The main characteristics of oligopoly is [Question ID = 19754][Question Description = Ph.D_ECOH_Q_063]
1. Close substitute [Option ID = 137212]
2. Few sellers [Option ID = 137213]
3. No product differentiation [Option ID = 137214]
4. Interdependence of firms [Option ID = 137215]
64) The GDP deflator which measures the price level is the
[Question ID = 19755][Question Description = Ph.D_ECOH_Q_064]
1. Ratio of real GDP to nominal GDP
[Option ID = 137216]
2. Ratio of GNP and GDP
[Option ID = 137217]
3. Ratio of nominal GDP to real GDP
[Option ID = 137218]
4. GDP
[Option ID = 137219]
65) Phillips curve that includes inflationary expectation as a determinant of inflation rate is known as [Question ID = 19756]
[Question Description = Ph.D_ECOH_Q_065]
1. Augmented Phillips curve [Option ID = 137220]
2. Short run Phillips curve [Option ID = 137221]
3. Inflation curve [Option ID = 137222]
4. Money curve [Option ID = 137223]
66) Exchange rate is depreciated to remove the inflation differential between domestic country and its trading partner is
known as [Question ID = 19757][Question Description = Ph.D_ECOH_Q_066]
1. Crawling peg [Option ID = 137224]
2. Exchange rate overshooting [Option ID = 137225]
3. Beggar thy neighbor policy [Option ID = 137226]
4. monetisation [Option ID = 137227]
67) A demand curve, which is parallel to the horizontal axis, showing quantity, has the price elasticity equal to
Page 11
1. Zero
[Option ID = 137228]
2. Infinity
[Option ID = 137229]
3. Less than one
[Option ID = 137230]
4. One
[Option ID = 137231]
68) Which of the following conditions specify the least cost‐output combination?
[Question ID = 19759][Question Description = Ph.D_ECOH_Q_068]
1. PL/Pk = MRTS
[Option ID = 137232]
2. PL/Pk = MPL/MPk
[Option ID = 137233]
3. MPk/MPL = dL/dK
[Option ID = 137234]
4. Cannot say
[Option ID = 137235]
69) For substitutes, cross elasticity of demand is[Question ID = 19760][Question Description = Ph.D_ECOH_Q_069]
1. Positive [Option ID = 137236]
2. Negative [Option ID = 137237]
3. Zero [Option ID = 137238]
4. Always less than one [Option ID = 137239]
1. Given that the Cobb‐Douglas production function is: y = ALα Kβ, α, β > 0
70)
Match List – I with List – II and select the answer from the codes given below:
List – I List – II
I. Increasing returns to scale i. α + β = 1
II. Decreasing returns to scale ii. α + β > 1
III. Constant returns to scale iii. α + β < 1
IV. Diminishing returns to factors iv. α, β < 1
Codes:
[Question ID = 19761][Question Description = Ph.D_ECOH_Q_070]
1. i ii iii iv
[Option ID = 137240]
2. i iii iv ii
[Option ID = 137241]
3. ii iii i iv
[Option ID = 137242]
4. iv ii iii i
[Option ID = 137243]
71) As long as the substitution effect dominates the income effect, the labour supply curve is [Question ID = 19762]
[Question Description = Ph.D_ECOH_Q_071]
1. negatively sloped [Option ID = 137244]
2. positively sloped [Option ID = 137245]
3. bend backward [Option ID = 137246]
4. shifting towards left [Option ID = 137247]
72) Suppose the money supply and the price level are constant, and the demand for money is a function of income and
interest rate. When the income level increases, there is [Question ID = 19763][Question Description = Ph.D_ECOH_Q_072]
1. an increase in the quantity of money demanded and an increase in the rate of interest. [Option ID = 137248]
2. an increase in the quantity of money demanded and a decrease in the rate of interest. [Option ID = 137249]
3. a decrease in the quantity of money demanded and a decrease in the rate of interest. [Option ID = 137250]
4. a decrease in the quantity of money demanded and an increase in the rate of interest. [Option ID = 137251]
73) Assertion (A): In liquidity trap, the demand for money is perfectly interest elastic. Reason (R): Because in this situation,
all the investors expect the market rate of interest to rise towards the natural rate of interest.
[Question ID = 19764][Question Description = Ph.D_ECOH_Q_073]
Page 12
[Option ID = 137252]
2. (A) and (R) both are correct, but (R) is not the correct explanation of (A).
[Option ID = 137253]
3. (A) is correct, but (R) is incorrect.
[Option ID = 137254]
4. Both (A) and (R) are incorrect.
[Option ID = 137255]
74) If A, B, C are independent events then which one is not true?[Question ID = 19765][Question Description =
Ph.D_ECOH_Q_074]
1. P(AUBUC)= P(A). P(B). P(C) [Option ID = 137256]
2. P(AUBUC)= P(A)+P(B)+P(C)‐P(A)[ P(B)+P(C)]‐P(B).P(C) + P(A). P(B). P(C) [Option ID = 137257]
3.
[Option ID = 137258]
4.
[Option ID = 137259]
75) A problem in Econometric is given to three scholars A1, A2, A3 whose chance of solving it are ½, ¾ and ¼ respectively.
What is the probability that the problem will be solved if all of them try independently? [Question ID = 19766][Question
Description = Ph.D_ECOH_Q_075]
1. 6/4 [Option ID = 137260]
2. 29/32 [Option ID = 137261]
3. 20/32 [Option ID = 137262]
4. ¾ [Option ID = 137263]
76) The Census data is [Question ID = 19767][Question Description = Ph.D_ECOH_Q_076]
1. Secondary data [Option ID = 137264]
2. Primary data [Option ID = 137265]
3. Continuous data [Option ID = 137266]
4. Time series data [Option ID = 137267]
77) Which is not true about the Chebyshev inequality?[Question ID = 19768][Question Description = Ph.D_ECOH_Q_077]
1.
[Option ID = 137268]
2.
[Option ID = 137269]
3.
[Option ID = 137270]
4. All the above are true. [Option ID = 137271]
78) Markov inequality and Chebyshev’s inequality [Question ID = 19769][Question Description = Ph.D_ECOH_Q_078]
1. In Markov inequality the X variable is non‐negative random variable whereas in chebyshev’s inequality is random variable. [Option ID = 137272]
2. In Markov inequality the X variable is non‐negative random variable whereas in chebyshev’s inequality is non‐negative random variable. [Option ID
= 137273]
3. Both have random variable [Option ID = 137274]
4. Impossible to know [Option ID = 137275]
79) Find the true one for the Markov inequality and Chebyshev’s inequality [Question ID = 19770][Question Description =
Ph.D_ECOH_Q_079]
1.
[Option ID = 137276]
2.
[Option ID = 137277]
3.
[Option ID = 137278]
4. Both I and II are true [Option ID = 137279]
80) See the following statements
Page 13
(II) The weight of chocolate box is measured in Interval data
(III) Number of students enrolled in each IIT in the year 2021for the M.Sc. Statistics is cross‐sectional data.
Which of the above statement(s) is/are correct?
[Question ID = 17712][Question Description = Ph.D_ECOH_Q_080]
1. I and II only
[Option ID = 137280]
2. I and III only
[Option ID = 137281]
3. II and III only
[Option ID = 137282]
4. I, II and III
[Option ID = 137283]
81) Data collected through large survey and found that the frequency distribution of data reveals the following measures as
central value =62, median =65 and coefficient of skewness = ‐0.30. the standard deviation equal to
[Question ID = 17713][Question Description = Ph.D_ECOH_Q_081]
1. 10
[Option ID = 137284]
2. 20
[Option ID = 137285]
3. 30
[Option ID = 137286]
4. 40
[Option ID = 137287]
82) Which of the following is not correct statement?
[Question ID = 19772][Question Description = Ph.D_ECOH_Q_082]
1.
[Option ID = 137356]
2.
[Option ID = 137357]
3.
[Option ID = 137358]
4. Mode =3Median – 2 Mean: This can be used in skewness
[Option ID = 137359]
83) The r between the marks obtained in Statistics and Indian Economy in first semester exam of MA for 72 students is
0.77. After moderation of marks of Statistics it was found that all students’ marks increased by 3 for 72 students. What is
the correlation coefficients of revised marks of Statistics and Indian economy marks ?
[Question ID = 17714][Question Description = Ph.D_ECOH_Q_083]
1. 0.74
[Option ID = 137288]
2. 0.77
[Option ID = 137289]
3. 0.8
[Option ID = 137290]
4. 0.83
[Option ID = 137291]
84) The Grossman model is
[Question ID = 17715][Question Description = Ph.D_ECOH_Q_084]
1. Model for studying the demand for health and medical care
[Option ID = 137292]
2. Model for studying the demand medical device
[Option ID = 137293]
3. It is Optical model for Income
[Option ID = 137294]
Page 14
[Option ID = 137295]
85) The type II error is used
[Question ID = 17716][Question Description = Ph.D_ECOH_Q_085]
1. To know the power of the test
[Option ID = 137296]
2. A guilty person is not convicted
[Option ID = 137297]
3. False negative
[Option ID = 137298]
4. All the above
[Option ID = 137299]
86) How you will define the baseline prediction? in regression, where data values and the best fit line for the x and y
coordinates. x: independent variable and the y: dependent variable in the model.
[Question ID = 17717][Question Description = Ph.D_ECOH_Q_086]
1. The baseline prediction in regression is the mean value of the dependent variable.
[Option ID = 137300]
2. The baseline prediction in regression is the mean value of the independent variable.
[Option ID = 137301]
3. The baseline prediction in regression is the mean value of the independent and dependent variables.
[Option ID = 137302]
4. Impossible to know
[Option ID = 137303]
87) The Error sums of square SSE used in the which statistical test. Choose the correct statement:
Statement I: Used in the ANOVA Test
Statement II: Used in Regression analysis
Statement III: Used in t‐test
Statement IV: Used in one sample t‐test
[Question ID = 17718][Question Description = Ph.D_ECOH_Q_087]
1. I and III are correct
[Option ID = 137304]
2. I and II are correct
[Option ID = 137305]
3. I and IV are correct
[Option ID = 137306]
4. All statements are correct
[Option ID = 137307]
88) Which one is not true ?
[Question ID = 17719][Question Description = Ph.D_ECOH_Q_088]
1. The Error sums of square is computed by summing the squared errors between the actual values and predictions value.
[Option ID = 137308]
2. The R2 calculated with the formula is: R2 = 1 + SSE/SST
[Option ID = 137309]
3. The R2 calculated with the formula is: R2 = 1 ‐ SSE/SST
[Option ID = 137310]
4. The null hypothesis H0 : β = 0, i.e. that there is no linear relation in x and y, we can test this hypothesis explicitly using an F − test.
[Option ID = 137311]
89) In the regression analysis if adding another variable, for example temperature, to our regression model to forecast
covid case. Can you state about the regression model's R2 value going to decrease from 0.63 to 0.60?
[Question ID = 17720][Question Description = Ph.D_ECOH_Q_089]
1. No, the model's R2 value can only decrease to 0.62 by adding new another variable.
[Option ID = 137312]
2. No, the model's R2 value cannot decrease at all by adding new another variable.
[Option ID = 137313]
3. Yes, the R2 value could decrease to 0.60.
Page 15
4. Yes, the R2 value could decrease sometimes or increases
[Option ID = 137315]
90)
[Question ID = 17721][Question Description = Ph.D_ECOH_Q_090]
1.
[Option ID = 137316]
2.
[Option ID = 137317]
3.
[Option ID = 137318]
4. c [Option ID = 137319]
91) CI ‐ Confidence limits for the population mean differences can be found only when:
[Question ID = 17722][Question Description = Ph.D_ECOH_Q_091]
1. The observation on two variable is paired
[Option ID = 137320]
2. The two variables are correlated
[Option ID = 137321]
3. Both of the above
[Option ID = 137322]
4. None of the above
[Option ID = 137323]
92) In Sampling and testing theory: A function of variates for estimating a parameter is
[Question ID = 17723][Question Description = Ph.D_ECOH_Q_092]
1. An estimates
[Option ID = 137324]
2. A frame
[Option ID = 137325]
3. A statistic
[Option ID = 137326]
4. An estimator
[Option ID = 137327]
93) To look the average expenditure incurred from Covid treatment in private and public hospitals test with t test and it is
categorized as
[Question ID = 17724][Question Description = Ph.D_ECOH_Q_093]
1. A Statistic
[Option ID = 137328]
2. An estimators
[Option ID = 137329]
3. An estimates
[Option ID = 137330]
4. Impossible to know
[Option ID = 137331]
94) The number of subsets of ( 1,2,3,4,5,6,7,8,9,10) having an odd number of elements is ……
[Question ID = 17725][Question Description = Ph.D_ECOH_Q_094]
1. 613
[Option ID = 137332]
2. 673
[Option ID = 137333]
3. 523
[Option ID = 137334]
4. 512
[Option ID = 137335]
95) The number of subsets of { 1,2,3,4,5,6,7,8,9,10} having an even number of elements is …….[Question ID = 17726]
Page 16
1. 511 [Option ID = 137336]
2. 611 [Option ID = 137337]
3. 523 [Option ID = 137338]
4. 623 [Option ID = 137339]
96) The number of real solution of ex = Sin(x) is …………….[Question ID = 17727][Question Description = Ph.D_ECOH_Q_096]
1. infinite [Option ID = 137340]
2. 1 [Option ID = 137341]
3. Zero [Option ID = 137342]
4. 7 [Option ID = 137343]
97) Find the mean proportional between 25 a2 and 64a2 [Question ID = 17728][Question Description = Ph.D_ECOH_Q_097]
1. 2a2 [Option ID = 137344]
2. 45a2 [Option ID = 137345]
3. 40a2 [Option ID = 137346]
4. 0 [Option ID = 137347]
98) Two numbers are in the ratio of 4:5 and when 1 is added to each the ratio becomes 5:6. Find both numbers. [Question
ID = 17729][Question Description = Ph.D_ECOH_Q_098]
1. 4 and 5 [Option ID = 137348]
2. 7 and 8 [Option ID = 137349]
3. 3 and 8 [Option ID = 137350]
4. 8 [Option ID = 137351]
99) When the demand for Oxygen (X) in Delhi is X = 700 – 7P at price P. What will be the maximum price in the third
phase of Corona that an individual will pay? [Question ID = 19771][Question Description = Ph.D_ECOH_Q_099]
1. 300 [Option ID = 137352]
2. 400 [Option ID = 137353]
3. 700 [Option ID = 137354]
4. 100 [Option ID = 137355]
100) The rate of fall of MR curve is ……. the rate of fall of AR Curve..
[Question ID = 19773][Question Description = Ph.D_ECOH_Q_100]
1. twice
[Option ID = 137360]
2. thrice
[Option ID = 137361]
3. half
[Option ID = 137362]
4. equal
[Option ID = 137363]