MBOSE Class 11 Question Paper 2020 for Economics
Finished viewing? Save it for later —
Download MBOSE Class 11 Question Paper 2020 for Economics (PDF · 4 pages)About MBOSE Class 11 Question Paper 2020 for Economics
MBOSE Class 11 Question Paper 2020 for Economics is available here for free download. Published by Meghalaya Board for Class 11, this question paper can be viewed online or downloaded as a PDF (4 pages). Candidates preparing for Class 11 can use MBOSE Class 11 Question Paper 2020 for Economics to understand the exam pattern, the type of questions asked, and the overall difficulty level.
Frequently Asked Questions
How can I download MBOSE Class 11 Question Paper 2020 for Economics?
Open this page and click the Download button to save MBOSE Class 11 Question Paper 2020 for Economics as a PDF. It is completely free on AglaSem Docs.
Is MBOSE Class 11 Question Paper 2020 for Economics free to download?
Yes. MBOSE Class 11 Question Paper 2020 for Economics can be viewed online and downloaded as a PDF free of cost on AglaSem Docs.
How many pages does MBOSE Class 11 Question Paper 2020 for Economics have?
MBOSE Class 11 Question Paper 2020 for Economics contains 4 pages, which you can read online or download together as a single PDF.
Where can I find more Class 11 study material?
You can find more Class 11 question papers, sample papers, syllabus, and answer keys on AglaSem Docs.
MBOSE Class 11 Question Paper 2020 for Economics – Text
Read the full text of this question paper below — useful to quickly search, copy and reference the content online without downloading the PDF.
📄 View text version (4 pages)
Page 1
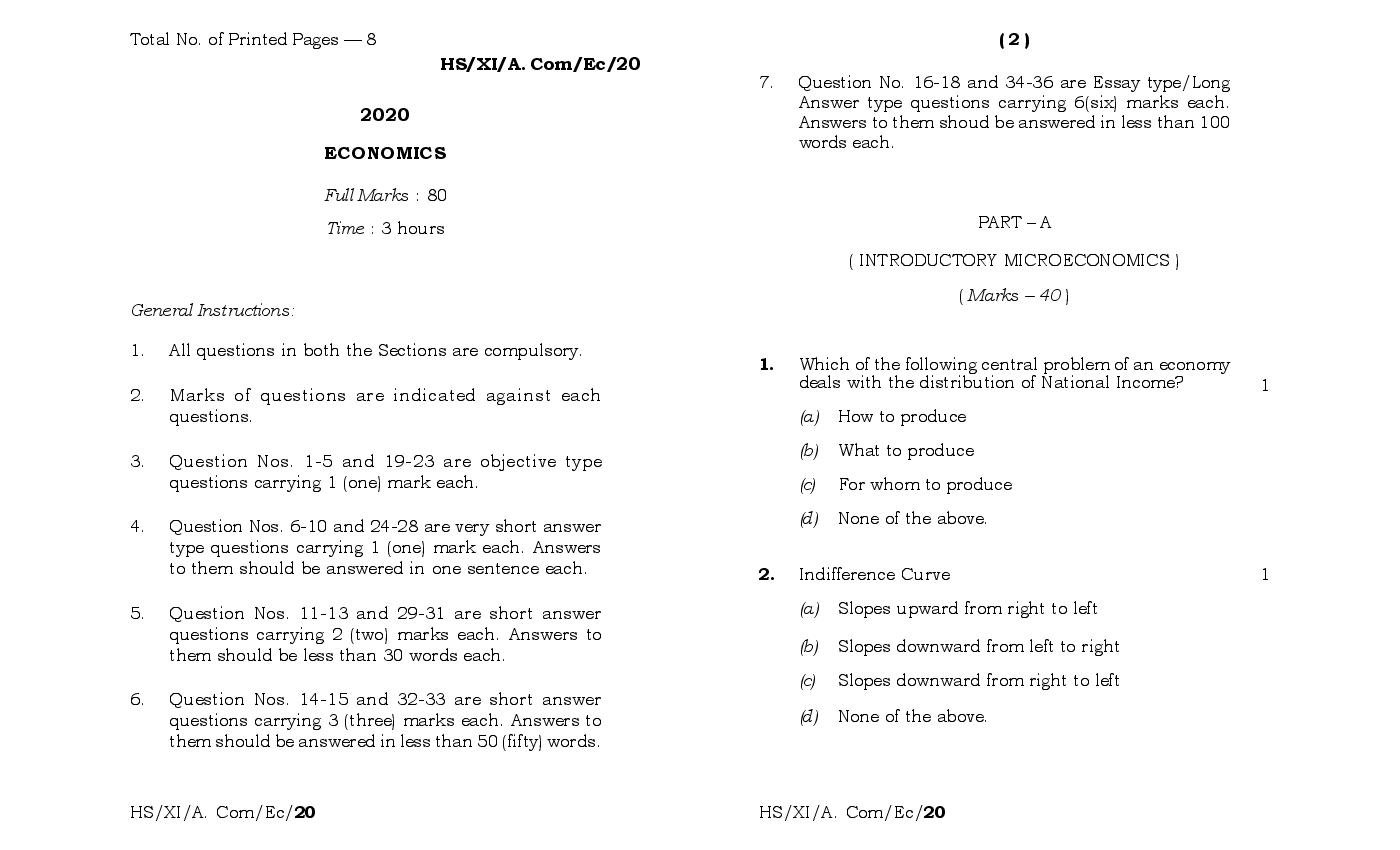
HS/XI/A. Com/Ec/20
7. Question No. 16-18 and 34-36 are Essay type/Long
Answer type questions carrying 6(six) marks each.
2020 Answers to them shoud be answered in less than 100
words each.
ECONOMICS
Full Marks : 80
Time : 3 hours PART – A
( INTRODUCTORY MICROECONOMICS )
General Instructions:
1. All questions in both the Sections are compulsory.
1. Which of the following central problem of an economy
deals with the distribution of National Income? 1
2. Marks of questions are indicated against each
questions. (a) How to produce
(b) What to produce
3. Question Nos. 1-5 and 19-23 are objective type
questions carrying 1 (one) mark each. (c) For whom to produce
4. Question Nos. 6-10 and 24-28 are very short answer (d) None of the above.
type questions carrying 1 (one) mark each. Answers
to them should be answered in one sentence each. 2. Indifference Curve 1
5. Question Nos. 11-13 and 29-31 are short answer (a) Slopes upward from right to left
questions carrying 2 (two) marks each. Answers to
(b) Slopes downward from left to right
them should be less than 30 words each.
(c) Slopes downward from right to left
6. Question Nos. 14-15 and 32-33 are short answer
questions carrying 3 (three) marks each. Answers to (d) None of the above.
them should be answered in less than 50 (fifty) words.
HS/XI/A. Com/Ec/20 HS/XI/A. Com/Ec/20
Page 2
3. A rise in Income of the consumer x leads to a fall in 6. What is the meaning of the central problem ‘What to
the demand for the good ‘A’ by him. What is the good Produce’? 1
‘A’ called. 1
(a) Complementary good 7. Define Utility. 1
(b) Substitute good 8. Define Indifference Map. 1
(c) Inferior good
9. What is market supply curve? 1
(d) Normal good.
10. What is constant returns to scale? 1
4. Which cost do not change when the output changes 11. What do you understand by normative economic
in the short run? 1 analysis. 2
(a) Average variable cost
12. Define a budget line. When can it shift to the right?
(b) Total variable cost 1+1=2
13. Give the relationship between Total Utility and
(c) Average fixed cost
Marginal Utility. 2
(d) Total fixed cost.
14. Draw and explain the Average Fixed Cost Curve. 1 + 2 = 3
5. How does Average Revenue curve under perfectly
competetive market looks like? 1 15. What do you mean by complementary goods. Give
examples of two goods which are complementary to
(a) Downward sloping each other. 3
(b) Straight line parallel to X-axis
16. Explain the law of demand with the help of a diagram. 6
(c) Upward sloping
17. What is the law of Variable Proportions? Explain with
(d) Straight line parallel to Y-axis the help of a diagram. 6
HS/XI/A. Com/Ec/20 HS/XI/A. Com/Ec/20
Page 3
18. Explain the effect of a ‘Price Ceiling’. 6 21. Raw data is made comprehensible by 1
(a) Collection of data.
OR
(b) Classification of data.
Explain Market Equilibrium. Show how equilibrium
changes when demand curve shift upward. 4+ 2=6 (c) Organisation of data.
PART – B (d) Presentation of data.
( STATISTICS FOR ECONOMICS )
22. Which is the crudest measure of dispersion? 1
(a) Range.
19. Technique which gives every item of the universe an (b) Inter Quartile Range.
equal chance of being selected is ________. 1
(c) Semi Inter Quartile Range.
(a) Convenient sampling.
(d) Mean Deviation.
(b) Random sampling.
(c) Judgement sampling.
23. Which part of a table gives us the numerical
(d) Non-Random sampling. information? 1
(a) Title.
20. NSSO provides periodic estimates of 1
(b) Caption.
(a) Literacy and utilisation of educational service.
(c) Stub.
(b) Employment and unemployment.
(d) Body.
(c) Manufacturing and service sector enterprise.
(d) All of these. 24. What is distribution? 1
Page 4
25. What is sampling error? 1 33. What is Index number? Give any two importance of
Index number. 3
26. Calculate Mode for the following data- 1
x : 2, 2, 4, 1, 2. 34. Find out Median from the following data. 6
Marks : 0-10 10-20 20-30 30-40 40-50
27. What value divides a distribution into two equal parts? 1
No. of : 08 30 40 12 10
Students
28. Draw a scatter diagram for a given distribution. 1
35. Find the Standard Deviation for the following
29. State the importance of Statistics in Economics. 2 distribution : 6
Class Interval Frequency
30. Draw a Simple Bar digram for the following data : 2
0 – 50 15
Year Food grain production (in tonnes)
50 – 100 20
2016 400
100 – 150 18
2017 500
150 – 200 25
2018 300
200 – 250 22
2019 600
31. Calculate Arithmetic Mean from the following marks 36. Explain the importance of Consumer Price Index. 6
of the students in an Economics test 2 OR
40, 50, 60, 70, 90
Mention the different types of Index Numbers?
Explain any one of them. 2+4=6
32. What is correlation? Distinguish between positive and
negative correlation. 3
Document Details
| Board / Org | Meghalaya Board |
| Exam | Class 11 |
| Type | Question Paper |
| Pages | 4 |
| Updated | 30 Apr 2026 |