Karnataka 1st PUC Model Question Paper 2027 for Statistics (Paper 1)
Finished viewing? Save it for later —
Download Karnataka 1st PUC Model Question Paper 2027 for Statistics (Paper 1) (PDF · 4 pages)About Karnataka 1st PUC Model Question Paper 2027 for Statistics (Paper 1)
Karnataka 1st PUC Model Question Paper 2027 for Statistics (Paper 1) is available here for free download. Published by Karnataka Board for Class 11, this sample paper can be viewed online or downloaded as a PDF (4 pages). Candidates preparing for Class 11 can use Karnataka 1st PUC Model Question Paper 2027 for Statistics (Paper 1) to understand the exam pattern, the type of questions asked, and the overall difficulty level.
Frequently Asked Questions
How can I download Karnataka 1st PUC Model Question Paper 2027 for Statistics (Paper 1)?
Open this page and click the Download button to save Karnataka 1st PUC Model Question Paper 2027 for Statistics (Paper 1) as a PDF. It is completely free on AglaSem Docs.
Is Karnataka 1st PUC Model Question Paper 2027 for Statistics (Paper 1) free to download?
Yes. Karnataka 1st PUC Model Question Paper 2027 for Statistics (Paper 1) can be viewed online and downloaded as a PDF free of cost on AglaSem Docs.
How many pages does Karnataka 1st PUC Model Question Paper 2027 for Statistics (Paper 1) have?
Karnataka 1st PUC Model Question Paper 2027 for Statistics (Paper 1) contains 4 pages, which you can read online or download together as a single PDF.
Where can I find more Class 11 study material?
You can find more Class 11 question papers, sample papers, syllabus, and answer keys on AglaSem Docs.
Karnataka 1st PUC Model Question Paper 2027 for Statistics (Paper 1) – Text
Read the full text of this sample paper below — useful to quickly search, copy and reference the content online without downloading the PDF.
📄 View text version (5 pages)
Page 1
Karnataka 1st PUC
Model Question Paper
2027 for Statistics
(Paper 1)
EXAM YEAR TYPE SUBJECT
Karnataka Class 11 2027 Sample Paper Statistics
Notes · Sample Papers · Previous Year Papers · Mock Tests
Page 2
m .co
c. o
e m
em l a s
s `
a g
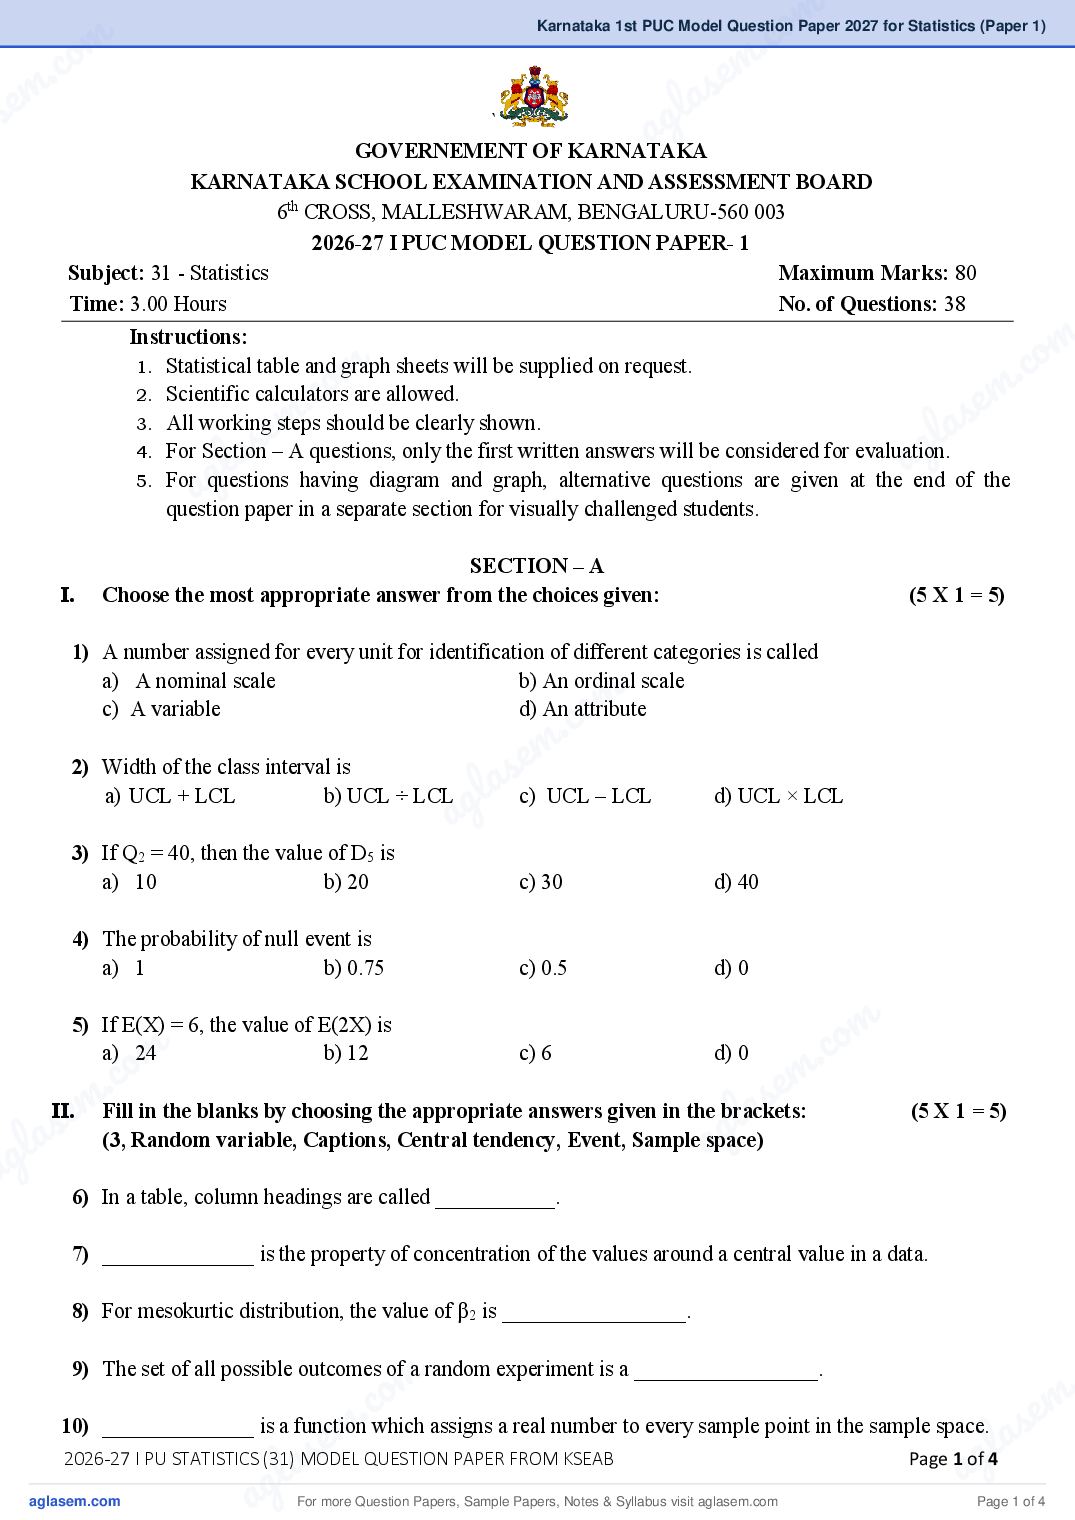
GOVERNEMENT OF KARNATAKA
KARNATAKA SCHOOL EXAMINATION AND ASSESSMENT BOARD
6th CROSS, MALLESHWARAM, BENGALURU-560 003
2026-27 I PUC MODEL QUESTION PAPER- 1
Subject: 31 - Statistics Maximum Marks: 80
Time: 3.00 Hours No. of Questions: 38
m
c. o
Instructions:
m
co m
1. Statistical table and graph sheets will be supplied on request.
m .
2. Scientific calculators are allowed.
s e
s e
3. All working steps should be clearly shown.
a g la
l a
ag
4. For Section – A questions, only the first written answers will be considered for evaluation.
5. For questions having diagram and graph, alternative questions are given at the end of the
question paper in a separate section for visually challenged students.
SECTION – A
I. Choose the most appropriate answer from the choices given: (5 X 1 = 5)
1) A number assigned for every unit for identification of different categories is called
m
co
a) A nominal scale b) An ordinal scale
.
c) A variable d) An attribute
em
sc) UCL – LCL
2) Width of the class interval is
g l a
a
a) UCL + LCL b) UCL ÷ LCL d) UCL × LCL
3) If Q2 = 40, then the value of D5 is
a) 10 b) 20 c) 30 d) 40
4) The probability of null event is
a) 1 b) 0.75 c) 0.5 d) 0
o m
m .c
5) If E(X) = 6, the value of E(2X) is
. co m
a) 24 b) 12 c) 6 d) 0
s e
II.emFill in the blanks by choosing the appropriate answers given in the brackets:
s g l a
la
(5 X 1 = 5)
g
(3, Random variable, Captions, Central tendency, Event, Sample a
space)
a 6) In a table, column headings are called ___________.
7) ______________ is the property of concentration of the values around a central value in a data.
8) For mesokurtic distribution, the value of β2 is _________________.
o m
9) The set of all possible outcomes of a random experiment is a _________________.
m .
c
.which assigns a real number to every sample point in the sample space. se
m
e QUESTION PAPER FROM KSEAB a
s Page 1 ofg4l
10) ______________ is a function
g la
2026-27 I PU STATISTICS (31) MODEL
a
a For more Question Papers, Sample Papers, Notes & Syllabus visit Page 1 of 4
Page 3
11) A B
a. Error of inadequacy i. Harmonic mean
b. Pie chart ii. Absolute measure
c. Average speed iii. 1
d. Standard deviation iv. Cause of statistical error
e. P(A) + P(Ac) v. 0
vi. Two-dimensional diagram
IV. Answer the following questions: (5 X 1 = 5)
12) Which graph is used to locate median?
13) Find mode from the following data:
3, 4, 5, 5, 6, 8, 5, 7, 5, 8, 5, 5, 4, 5, 3
14) What is the relationship among Mean, Median and Mode for a symmetrical distribution?
15) Define interpolation.
16) What is the value of ‘r’ for two independent random variables?
SECTION – B
V. Answer any FIVE of the following questions: (5 X 2 = 10)
17) Write two branches of Statistics.
18) Mention the two stages of statistical enquiry.
19) Find geometric mean of 1, 4 and 16.
20) Calculate coefficient of range for the following data:
Height (cms): 160, 158, 159, 165, 148, 139, 142, 155.
21) If n = 9 and Σd2 = 24, find the coefficient of rank correlation.
22) What is the difference between coefficient of correlation and coefficient of association?
23) If A and B are mutually exclusive events and P(A) = 0.4 and P(B) = 0.5 then, find P(A∪B).
24) If X is a random variable and a is a constant, then prove that E(a) = a.
SECTION – C
VI. Answer any FOUR of the following questions: (4 X 5 = 20)
25) Mention any five functions of Statistics.
26) Define primary data. Mention the methods of collection of primary data.
2026-27 I PU STATISTICS (31) MODEL QUESTION PAPER FROM KSEAB Page 2 of 4
For more Question Papers, Sample Papers, Notes & Syllabus visit Page 2 of 4
Page 4
m .co
c.27)o Marks obtained by the students in a certain test are given below. se
m
m 25 la
se 37
18
49
35
54
33
51
42
37
45
15
55
12
69
33
63 46 a29
23
g
18 37 46 59 29 35 27 45 47 65
Prepare a frequency distribution table with the class intervals 10–20, 20–30, ……….
28) Prepare a blank table showing the particulars relating to the residents of a certain locality according to,
i) Occupation: Office assistants, Business men, Teachers, Bank employees.
ii) Sex: Men, Women.
m
c. o
iii) Marital status: Married, Single.
m
.co s e m
m la
29) The production of wheat and rice of a region are given below:
s e g
a
Year 2005 2006 2007 2008 2009 2010
l a
ag
Production Wheat 12 15 18 19 22 26
(in metric tons) Rice 25 30 32 36 40 45
Draw a multiple bar diagram to represent the data.
30) Compute Yule’s coefficient of association between marriage and examination result from the following
data pertaining to 525 students.
Pass Fail
Married 90 65
Unmarried 260 110
o m
31) Using binomial expansion method, interpolate the m
. c
2012s
e 2013 2014 2015
missing index number from the following data.
Year 2011
g la
Index Number 100
a 107 ? 157 212
VII. Answer any TWO of the following questions: (2 X 5 = 10)
32) Draw histogram from the following data.
Marks 0 - 20 20 – 40 40 – 60 60 – 80 80 – 100
Number of students 5 15 30 20 10
m
m .co
c. o
33) Calculate mean deviation from mode for the following data.
m
se
x 0 1 2 3 4 5 6
s em f 18 22 35 25 20 12 2
g l a
gla 34) Following are the details of the marks scored by students in Kannada
a and English examination.
a Coefficient of correlation = 0.3
Kannada English
Mean 40 50
S.D. 10 16
Estimate the marks in Kannada when the scores in English is 30.
m .
35) A box contains 6 white and 4 black marbles. Two marbles are drawn at random from this box. Find the
.co e m
probability that they are of:
m
e QUESTION PAPER FROM KSEAB
(i) different colours (ii) the same colour.
l as
l a s Page 3 ofg4
a
g
2026-27 I PU STATISTICS (31) MODEL
a For more Question Papers, Sample Papers, Notes & Syllabus visit Page 3 of 4
Page 5
VIII. Answer any TWO of the following questions: (2 X 10 = 20)
36) Calculate Bowley’s coefficient of skewness from the following data.
C.I 30 – 40 40 – 50 50 – 60 60 – 70 70 – 80 80 – 90 90 – 100
f 1 3 11 43 32 21 9
37) Calculate Karl Pearson’s coefficient of correlation from the following data.
y
x
0 – 10 10 – 20 20 – 30 30 – 40
0 – 20 8 7 3 -
20 – 40 - 6 4 -
40 – 60 - 3 5 6
60 – 80 - - 1 7
38) a) A card is drawn from a pack of 52 playing cards. What is the probability that it is a king known that
drawn card is black?
b) A person, by paying Rs.5 enters into a game of shooting a target. With one shot, if he hits the target,
he gets Rs.25, otherwise, he gets nothing. If his probability of hitting a target is 0.2, then find his
expectation.
SECTION - E
(For Visually challenged students only)
29) Write down the procedure to draw multiple bar diagram.
32) Write down the procedure to draw histogram.
***
2026-27 I PU STATISTICS (31) MODEL QUESTION PAPER FROM KSEAB Page 4 of 4
For more Question Papers, Sample Papers, Notes & Syllabus visit Page 4 of 4
Document Details
| Board / Org | Karnataka Board |
| Exam | Class 11 |
| Type | Sample Paper |
| Pages | 4 |
| Updated | 13 Nov 2026 |