Karnataka 1st PUC Model Question Paper 2027 for Statistics (Paper 2)
Finished viewing? Save it for later —
Download Karnataka 1st PUC Model Question Paper 2027 for Statistics (Paper 2) (PDF · 4 pages)About Karnataka 1st PUC Model Question Paper 2027 for Statistics (Paper 2)
Karnataka 1st PUC Model Question Paper 2027 for Statistics (Paper 2) is available here for free download. Published by Karnataka Board for Class 11, this sample paper can be viewed online or downloaded as a PDF (4 pages). Candidates preparing for Class 11 can use Karnataka 1st PUC Model Question Paper 2027 for Statistics (Paper 2) to understand the exam pattern, the type of questions asked, and the overall difficulty level.
Frequently Asked Questions
How can I download Karnataka 1st PUC Model Question Paper 2027 for Statistics (Paper 2)?
Open this page and click the Download button to save Karnataka 1st PUC Model Question Paper 2027 for Statistics (Paper 2) as a PDF. It is completely free on AglaSem Docs.
Is Karnataka 1st PUC Model Question Paper 2027 for Statistics (Paper 2) free to download?
Yes. Karnataka 1st PUC Model Question Paper 2027 for Statistics (Paper 2) can be viewed online and downloaded as a PDF free of cost on AglaSem Docs.
How many pages does Karnataka 1st PUC Model Question Paper 2027 for Statistics (Paper 2) have?
Karnataka 1st PUC Model Question Paper 2027 for Statistics (Paper 2) contains 4 pages, which you can read online or download together as a single PDF.
Where can I find more Class 11 study material?
You can find more Class 11 question papers, sample papers, syllabus, and answer keys on AglaSem Docs.
Karnataka 1st PUC Model Question Paper 2027 for Statistics (Paper 2) – Text
Read the full text of this sample paper below — useful to quickly search, copy and reference the content online without downloading the PDF.
📄 View text version (5 pages)
Page 1
Karnataka 1st PUC
Model Question Paper
2027 for Statistics
(Paper 2)
EXAM YEAR TYPE SUBJECT
Karnataka Class 11 2027 Sample Paper Statistics
Notes · Sample Papers · Previous Year Papers · Mock Tests
Page 2
m .co
c. o
e m
em l a s
s `
a g
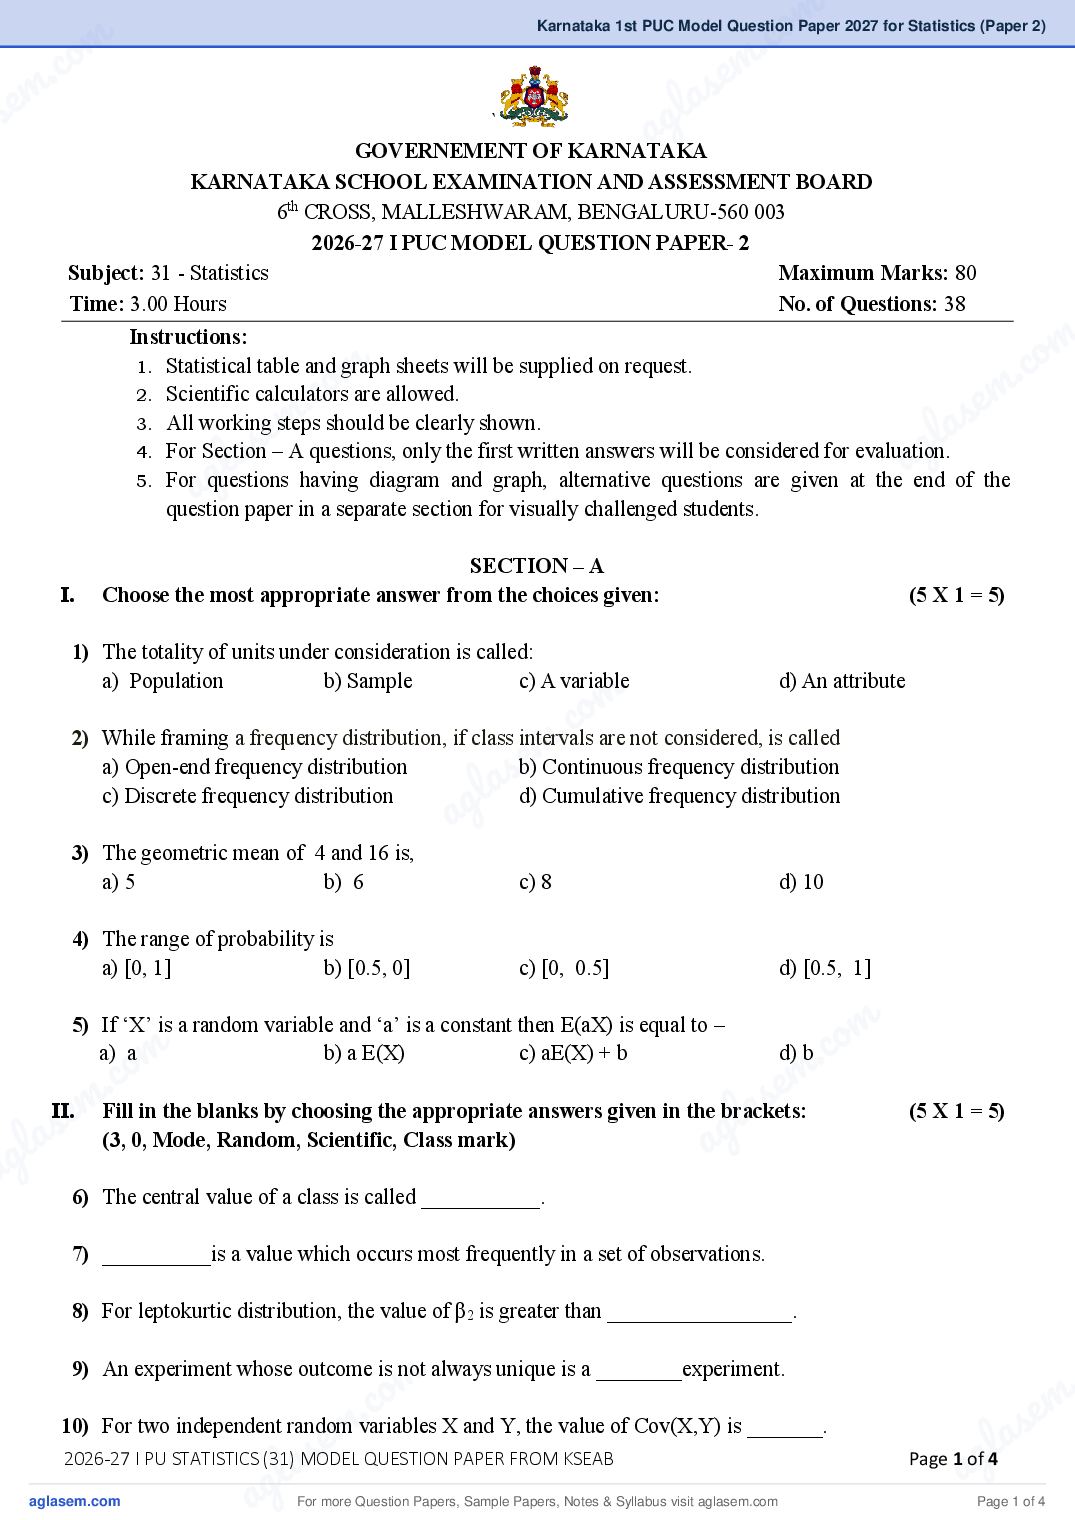
GOVERNEMENT OF KARNATAKA
KARNATAKA SCHOOL EXAMINATION AND ASSESSMENT BOARD
6th CROSS, MALLESHWARAM, BENGALURU-560 003
2026-27 I PUC MODEL QUESTION PAPER- 2
Subject: 31 - Statistics Maximum Marks: 80
Time: 3.00 Hours No. of Questions: 38
m
c. o
Instructions:
m
co m
1. Statistical table and graph sheets will be supplied on request.
m .
2. Scientific calculators are allowed.
s e
s e
3. All working steps should be clearly shown.
a g la
l a
ag
4. For Section – A questions, only the first written answers will be considered for evaluation.
5. For questions having diagram and graph, alternative questions are given at the end of the
question paper in a separate section for visually challenged students.
SECTION – A
I. Choose the most appropriate answer from the choices given: (5 X 1 = 5)
1) The totality of units under consideration is called:
om
a) Population b) Sample c) A variable d) An attribute
. c
s em
2) While framing a frequency distribution, if class intervals are not considered, is called
a) Open-end frequency distribution
l a
b) Continuous frequency distribution
g
a
c) Discrete frequency distribution d) Cumulative frequency distribution
3) The geometric mean of 4 and 16 is,
a) 5 b) 6 c) 8 d) 10
4) The range of probability is
a) [0, 1] b) [0.5, 0] c) [0, 0.5] d) [0.5, 1]
o m
m .c
5) If ‘X’ is a random variable and ‘a’ is a constant then E(aX) is equal to –
. co m
a) a b) a E(X) c) aE(X) + b d) b
s e
II.emFill in the blanks by choosing the appropriate answers given in the brackets:
s g l a
la
(5 X 1 = 5)
g
(3, 0, Mode, Random, Scientific, Class mark) a
a 6) The central value of a class is called ___________.
7) __________is a value which occurs most frequently in a set of observations.
8) For leptokurtic distribution, the value of β2 is greater than _________________.
o m
9) An experiment whose outcome is not always unique is a ________experiment.
m .
.c s e
e m l a
s QUESTION PAPER FROM KSEAB
10) For two independent random variables X and Y, the value of Cov(X,Y) is _______.
Page 1 ofg4
l a a
ag
2026-27 I PU STATISTICS (31) MODEL
For more Question Papers, Sample Papers, Notes & Syllabus visit Page 1 of 4
Page 3
11) A B
a. Direct personal observation i. 0
b. Percentage bar diagram ii. Standard deviation
c. Σ (x - x̅) iii. P(AC) = 0.4
d. Root mean square deviation iv. One dimensional diagram
e. P(A) = 0.6 v. Two dimensional diagram
vi. Primary data
IV. Answer the following questions: (5 X 1 = 5)
12) Name the average located from Histogram.
13) Define harmonic mean.
14) Define Mean deviation.
15) Define interpolation.
16) What is the value of V(4), if 4 is a constant?
SECTION – B
V. Answer any FIVE of the following questions: (5 X 2 = 10)
17) Write two limitations of Statistics.
18) Mention the sources of secondary data.
19) Find the HM of 4 and16.
20) Find mean if CV=10% and SD=4.
21) In a bi-variate data on x and y, Var(x) = 9, Var(y) = 49 and Cov(x, y) = 20. Find r.
22) What is meant by association of attributes? Name the different methods of measurement.
23) Two fair coins are tossed once. Find the probability of getting two heads.
24) If E(X) = 5 and E(X2) = 36, find V(X).
SECTION – C
VI. Answer any FOUR of the following questions: (4 X 5 = 20)
25) Mention any five Characteristics of Statistics.
26) Distinguish between census enumeration and sample survey.
2026-27 I PU STATISTICS (31) MODEL QUESTION PAPER FROM KSEAB Page 2 of 4
For more Question Papers, Sample Papers, Notes & Syllabus visit Page 2 of 4
Page 4
m .co
c.27)o In a survey of 40 families in a certain locality, the number of childrenseper family was recorded and the
m
m following data were obtained. la
se 1 0 3 2 1 5 6 2 2 1 0 3 4 2 5 6 3 2 a1 1 g
3 3 2 4 2 2 3 0 2 1 4 5 3 3 4 4 5 4 2 1
Represent the data in the form of a discrete frequency distribution.
28) Prepare a blank table to show the distribution of students according to
i. College: Government, Aided, Unaided.
m
ii. Faculty: Science, Commerce, Arts.
m c. o
iii. Gender: Boys, Girls.
.co s e m
em la
29) Represent the following data regarding the production of paddy (in ’000 tons) by simple bar diagram.
Year
l a s 2005 2006 2007 2008
a g
ag
Production 90 85 100 105
30) Compute Yule’s coefficient of Association from the following data.
(AB) = 150, N = 1000, (A) = 200, (B) = 300.
31) From the following data interpolate the production of cement in 2007.
Year 2005 2006 2007 2008 2009 2010
Production (lakh tons) 44 90 ̶ 160 270 390
m
. co
em
VII. Answer any TWO of the following questions: (2 X 5 = 10)
l a s
g
32) Draw a less than Ogive and locate the median from the graph.
Marks
No. of students
0-10
3
10-20
9
a
20-30
15
30-40
30
40-50
18
50-60
5
33) Calculate the first quartile and sixth decile from the following data.
x 58 59 60 61 62 63 64 65 66
f 2 3 6 15 10 5 4 3 1
m
co
34) Following are the marks of 8 students in Statistics and Mathematics. Find coefficient of rank correlation.
m .
c. o
Marks in Statistics 25 43 27 35 54 61 37 45
m
em se
Marks in Mathematics 35 47 20 37 63 54 28 40
s g l a
gla getting a card with: (i) an odd number (ii) a multiple of 4 (iii) a perfectasquare.
35) A box contains cards numbered from 1 to 20. A card is drawn randomly from it. Find the probability of
a
SECTION – D
VIII. Answer any TWO of the following questions: (2 X 10 = 20)
36) The number of runs scored by two batsmen A and B in different innings is as follows:
A 12 115 6 73 7 19 119 36 84 29
m .
B 47 12 76 42 4 51 37 48 13 0
i) Who is better run scorer?
.co s e m
ii) Who is more consistent?
m
e QUESTION PAPER FROM KSEAB l a
l a s Page 3 ofg4
a
g
2026-27 I PU STATISTICS (31) MODEL
a For more Question Papers, Sample Papers, Notes & Syllabus visit Page 3 of 4
Page 5
x 3 6 5 4 4 6 7 5
y 3 2 3 5 3 6 6 4
Also find correlation coefficient rxy.
38) a) In a hostel 60% of students drink tea, 50% of students drink coffee and 20% of students drink both
tea and coffee. Find the probability that a randomly selected student drinks either tea or coffee.
b) A random variable X which assumes the values -1, 0 and 1 with respective probabilities 1/4, 1/2 and
1/4. Find the mean and variance.
SECTION - E
(For Visually challenged students only)
29) Write down the procedure to draw simple bar diagram.
32) Write down the procedure to draw Ogives.
***
2026-27 I PU STATISTICS (31) MODEL QUESTION PAPER FROM KSEAB Page 4 of 4
For more Question Papers, Sample Papers, Notes & Syllabus visit Page 4 of 4
Document Details
| Board / Org | Karnataka Board |
| Exam | Class 11 |
| Type | Sample Paper |
| Pages | 4 |
| Updated | 13 Nov 2026 |