MBOSE Class 12 Question Paper 2019 for Statistics
Finished viewing? Save it for later —
Download MBOSE Class 12 Question Paper 2019 for Statistics (PDF · 11 pages)About MBOSE Class 12 Question Paper 2019 for Statistics
MBOSE Class 12 Question Paper 2019 for Statistics is available here for free download. Published by Meghalaya Board for Class 12, this question paper can be viewed online or downloaded as a PDF (11 pages). Candidates preparing for Class 12 can use MBOSE Class 12 Question Paper 2019 for Statistics to understand the exam pattern, the type of questions asked, and the overall difficulty level.
Frequently Asked Questions
How can I download MBOSE Class 12 Question Paper 2019 for Statistics?
Open this page and click the Download button to save MBOSE Class 12 Question Paper 2019 for Statistics as a PDF. It is completely free on AglaSem Docs.
Is MBOSE Class 12 Question Paper 2019 for Statistics free to download?
Yes. MBOSE Class 12 Question Paper 2019 for Statistics can be viewed online and downloaded as a PDF free of cost on AglaSem Docs.
How many pages does MBOSE Class 12 Question Paper 2019 for Statistics have?
MBOSE Class 12 Question Paper 2019 for Statistics contains 11 pages, which you can read online or download together as a single PDF.
Where can I find more Class 12 study material?
You can find more Class 12 question papers, sample papers, syllabus, and answer keys on AglaSem Docs.
MBOSE Class 12 Question Paper 2019 for Statistics – Text
Read the full text of this question paper below — useful to quickly search, copy and reference the content online without downloading the PDF.
📄 View text version (11 pages)
Page 1
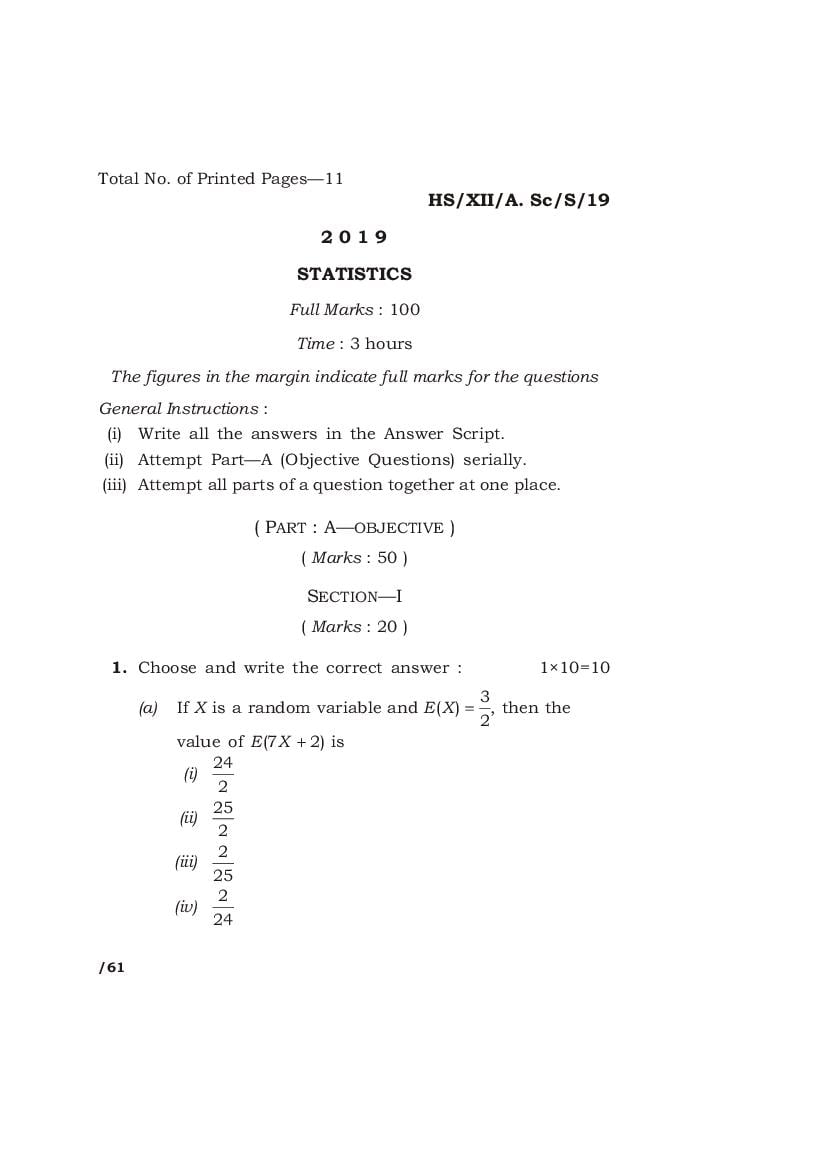
HS/XII/A. Sc/S/19
2019
STATISTICS
Full Marks : 100
Time : 3 hours
The figures in the margin indicate full marks for the questions
General Instructions :
(i) Write all the answers in the Answer Script.
(ii) Attempt Part—A (Objective Questions) serially.
(iii) Attempt all parts of a question together at one place.
( PART : A—OBJECTIVE )
( Marks : 50 )
SECTION—I
( Marks : 20 )
1. Choose and write the correct answer : 1×10=10
3
(a) If X is a random variable and E (X ) = , then the
2
value of E (7X + 2) is
24
(i)
2
25
(ii)
2
2
(iii)
25
2
(iv)
24
/61
Page 2
(b) If X is a random variable, then
(i) E (X 2 ) ³ { E (X )} 2
(ii) E (X 2 ) = { E (X )} 2
(iii) E (X 2 ) £ { E (X )} 2
(iv) None of the above
(c) In Poisson distribution
(i) variance < mean
(ii) variance = mean
(iii) variance > mean
(iv) None of the above
(d) A binomial variate X has mean 6 and variance 4.
Then the values of n and p are
2
(i) n = 28 and p =
3
(ii) n = 8 and p = 1
1
(iii) n = 18 and p =
3
(iv) None of the above
Page 3
(e) In an index number formula, the Time Reversal
Test is
(i) P 01 ´ P10 = 1
(ii) P 01 ´ P10 = 0
(iii) P 01 + P10 = 1
(iv) None of the above
(f) If the value of all commodities in the base year is
å p 0q 0 and the value of all commodities in the
current year is å p 1q 1, then the value index is
defined as
(i) V 01 =
å p1q 1 ´ 100
å p 0q 0
(ii) V 01 =
å p 0q 0 ´ 100
å p1q 1
(iii) V 01 = (å p 1q 1)(å p 0q 0 ) ´ 100
(iv) None of the above
Page 4
(g) Decrease in death rate due to advancement in
medical science can be classified under the head
(i) random
(ii) cyclical
(iii) seasonal
(iv) trend
(h) Time series consists of
(i) one component
(ii) two components
(iii) three components
(iv) four components
Page 5
(i) In SRSWOR, E (x ) = sample mean and X =
population mean. Then
(i) E (x ) > X
(ii) E (x ) = X
(iii) E (x ) < X
(iv) None of the above
(j) If s 2 is the population variance, then which of
the following is correct in case of SRSWR?
s2
(i) V (x ) >
n
s2
(ii) V (x ) <
n
s2
(iii) V (x ) =
n
(iv) None of the above
Page 6
2. Fill in the blanks : 1×5=5
(a) If X is a random variable and a is constant, then
V (aX ) = _____.
(b) If X follows binomial
distribution with
æX ö
parameters n and p, then E ç ÷ = _____.
èn ø
(c) Fisher’s index number is the _____ of Laspeyres’
and Paasche’s indices.
(d) Recession is associated with _____ variation of
time series.
(e) The relation between S 12 and s2 is
( N - 1)S 12 = _____s 2 .
3. State whether the following statements are True or
False : 1×5=5
(a) If f (x ) is a Probability Density Function, then
¥
f (x ) ³ 0 and ò f (x )dx = 1.
-¥
(b) In normal distribution, mean < median < mode.
Page 7
(c) Fisher’s index number does not satisfy ‘Factor
Reversal Test’.
(d) Natural cause such as changes in the climate
and weather conditions are associated with
Seasonal Variations.
(e) The total number of samples when sampling is
done without replacement from a population of
size N is N C n .
SECTION—II
( Marks : 30 )
4. Answer the following questions : 3×10=30
(a) If a random variable X takes the values 1, 2, 3
r
with probability P (X = r ) = : r = 1, 2, 3, then
6
find E (X ) and P (X ³ 2).
(b) If a die is thrown and let X denotes the point on
the uppermost face, then find E (X ).
(c) If X follows the Poisson distribution and
P (X = 1) = P (X = 2), then find the value of
P (X = 4).
Page 8
(d) If X is a normal variate with mean 5 and
standard deviation 4, then find (i) P (X < 13)
and (ii) P (X > 1.
) Given F(2) = 0 × 9772 and
F(1) = 0 × 8413.
(e) Write any three uses of Cost of Living Index
Number.
(f) Explain the term ‘Factor Reversal Test’.
(g) Enumerate the objective of analysis of time-
series.
(h) Write down the properties of normal
distribution.
(i) Write any three advantages of sample survey
over census.
(j) Explain the term ‘Principle of Statistical
Regularity’ in Sample Survey.
Page 9
( PART : B—DESCRIPTIVE )
( Marks : 50 )
Answer four questions, taking at least one from each Group
GROUP—A
5. (a) If 1% residents of a city are colour-blind, find
the probability that out of 100 persons selected
at random, at most one is colour-blind. 5
(b) Prove that E[(X - c )2 ] = Var(X ) + [E (X ) - c ]2 , where
c is a constant. 5
(c) Write down the mean and variance of the
following : 2½
x 5- x
æ 1ö æ1 ö æ1 ö
f ç x ; 5, ÷ = 5C x ç ÷ ç ÷ , x = 0, 1, 2, 3, 4, 5
è 2ø è2ø è2ø
6. (a) Prove that V (aX + b ) = a 2V (X ), where a and b are
constants. 5
(b) For a normal distribution, mean = 57·9765 and
3rd quartile = 60. Then find standard deviation. 2½
(c) In binomial distribution, prove that
n-x p
P (X = x + 1) = × × P (X = x ). 5
x +1 q
Page 10
GROUP—B
7. (a) Given the following data, compute Fisher’s price
index number. Also interpret the result : 5+1½=6½
Base Year Current Year
Commodity Price Quantity Price Quantity
A 5 7 7 4
B 3 2 4 3
C 1 5 1 5
D 4 4 6 3
(b) Show that Laspeyres’ price index number and
Paasche’s index number do not satisfy Factor
Reversal Test. 6
8. (a) Define a Time Series. What are its components?
Explain any one of them. 2+2+3=7
(b) Describe the method of moving average for
measurement of trend. 5½
Page 11
GROUP—C
9. (a) Write a note on the difference between census
and sample survey. 6
(b) In SRSWOR, show that E (x ) = X , i.e., the sample
mean is an unbiased estimator of population,
where x and X have usual meanings. 6½
10. (a) Write short notes on the following : 2×3=6
(i) Sampling error
(ii) Non-sampling error
(iii) Random sampling
(b) From the following data on stratified random
sampling, estimate the population mean : 4
Stratum size Sample size Sample mean
440 10 96·8
400 10 86·2
110 5 221·0
(c) What do you mean by stratified random
sampling? 2½
HHH
HS/XII/A. Sc/S/19/61 K9—50
Document Details
| Board / Org | Meghalaya Board |
| Exam | Class 12 |
| Type | Question Paper |
| Pages | 11 |
| Updated | 15 Jul 2026 |