MBOSE Class 12 Question Paper 2018 for Statistics
Finished viewing? Save it for later —
Download MBOSE Class 12 Question Paper 2018 for Statistics (PDF · 11 pages)About MBOSE Class 12 Question Paper 2018 for Statistics
MBOSE Class 12 Question Paper 2018 for Statistics is available here for free download. Published by Meghalaya Board for Class 12, this question paper can be viewed online or downloaded as a PDF (11 pages). Candidates preparing for Class 12 can use MBOSE Class 12 Question Paper 2018 for Statistics to understand the exam pattern, the type of questions asked, and the overall difficulty level.
Frequently Asked Questions
How can I download MBOSE Class 12 Question Paper 2018 for Statistics?
Open this page and click the Download button to save MBOSE Class 12 Question Paper 2018 for Statistics as a PDF. It is completely free on AglaSem Docs.
Is MBOSE Class 12 Question Paper 2018 for Statistics free to download?
Yes. MBOSE Class 12 Question Paper 2018 for Statistics can be viewed online and downloaded as a PDF free of cost on AglaSem Docs.
How many pages does MBOSE Class 12 Question Paper 2018 for Statistics have?
MBOSE Class 12 Question Paper 2018 for Statistics contains 11 pages, which you can read online or download together as a single PDF.
Where can I find more Class 12 study material?
You can find more Class 12 question papers, sample papers, syllabus, and answer keys on AglaSem Docs.
MBOSE Class 12 Question Paper 2018 for Statistics – Text
Read the full text of this question paper below — useful to quickly search, copy and reference the content online without downloading the PDF.
📄 View text version (11 pages)
Page 1
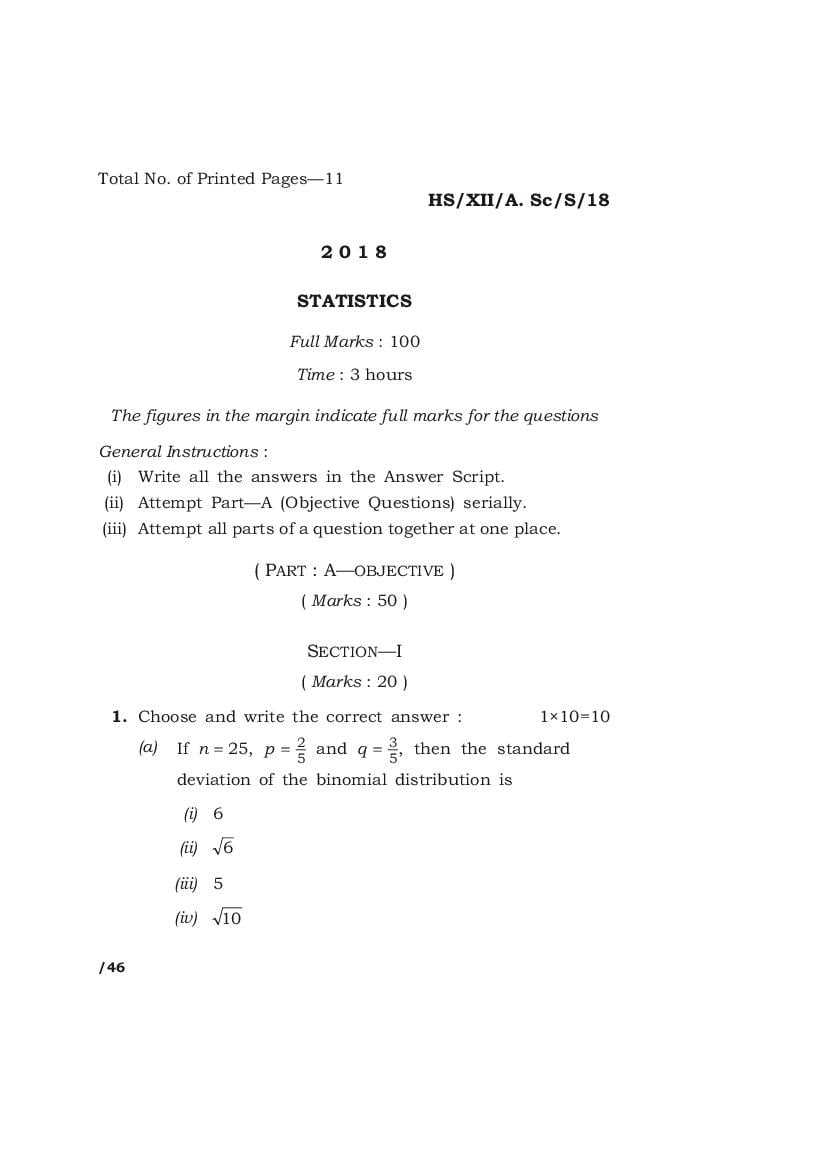
HS/XII/A. Sc/S/18
2018
STATISTICS
Full Marks : 100
Time : 3 hours
The figures in the margin indicate full marks for the questions
General Instructions :
(i) Write all the answers in the Answer Script.
(ii) Attempt Part—A (Objective Questions) serially.
(iii) Attempt all parts of a question together at one place.
( PART : A—OBJECTIVE )
( Marks : 50 )
SECTION—I
( Marks : 20 )
1. Choose and write the correct answer : 1×10=10
(a) If n = 25, p = 2 and q = 3, then the standard
5 5
deviation of the binomial distribution is
(i) 6
(ii) 6
(iii) 5
(iv) 10
/46
Page 2
(b) The equality of mean and variance of a discrete
distribution indicates that the distribution is
(i) Poisson
(ii) binomial
(iii) normal
(iv) hypergeometric
(c) If E (2X + 3) = 27, then the value of E (X ) is
(i) 12
(ii) 9
2
(iii) 5
(iv) 7
(d) The mean of a binomial distribution is 27 and
q = 1, then the variance is
3
(i) 81
(ii) 3
(iii) 9
(iv) 80
3
Page 3
(e) In a given business venture, a man can make
a profit of R 1,000 with probability 0·8 or take
a loss of R 400 with probability 0·2, then the
expectation is
(i) R 270
(ii) R 720
(iii) R 40,000
(iv) None of the above
(f) The price indices Laspeyres’, Paasche’s and
Fisher’s are related by which of the following
inequalities?
(i) Laspeyres ³ Fisher ³ Paasche
(ii) Laspeyres £ Fisher £ Paasche
(iii) Fisher ³ Laspeyres ³ Paasche
(iv) Paasche ³ Laspeyres ³ Fisher
(g) A binomial distribution is
(i) uniparametric
(ii) biparametric
(iii) triparametric
(iv) None of the above
Page 4
(h) Changes that take place as a result of natural
calamities are classified under the head
(i) secular movement
(ii) seasonal variations
(iii) cyclical variations
(iv) irregular variations
(i) Which of the following is not a method for
measuring trend?
(i) Graphic method
(ii) Moving-average method
(iii) Harmonic-analysis method
(iv) Least-squares method
(j) The most important factor(s) causing seasonal
variations is/are
(i) growth of population
(ii) depression in business
(iii) weather and social customs
(iv) None of the above
Page 5
2. Fill in the blanks : 1×5=5
(a) The term ‘parameter’ is used to denote the
characteristic of the _____.
(b) If m be the expected value of x, then
E (x - m) = _____.
(c) Fisher’s index number is called _____ index
number.
(d) Normal distribution is a _____ theoretical
distribution.
(e) _____ is the difference between the parameter
and its estimate obtained from the random
sample.
3. State whether the following statements are True or
False : 1×5=5
(a) In sampling distribution, a finite population of
8 units, samples of size 4 can be selected in
50 ways.
(b) In a binomial distribution, mean > variance.
(c) Trend can be measured by moving average
method.
Page 6
(d) Paasche’s price index is the geometric mean
of Laspeyre’s and Fisher’s price indices.
(e) In time-series analysis, the free-hand method
can represent both linear and nonlinear trends.
SECTION—II
( Marks : 30 )
4. Answer the following questions : 3×10=30
(a) A pair of dice is thrown 200 times. If getting
a sum of 9 is considered a success, find the
mean and variance of the number of successes.
(b) Find the variance of the random variable X ,
where the probability distribution is given by
the table :
X : 0 1 2 3
P (X ) : 0·15 0·40 0·25 0·20
(c) If X and Y are independent random variables,
then show that E [{ X - E (X )} {Y - E (Y )}] = 0.
(d) State some of the important factors responsible
for non-sampling errors in any survey (census
or sample).
Page 7
(e) What are the limitations of index number?
(f) Find the mean of the Poisson distribution.
(g) If X denotes the number of heads appear when
two coins are tossed, then by using the laws of
expectations, evaluate E (2X - 1)2 .
(h) Distinguish between seasonal variation and
cyclical variation.
(i) Define cost of living index number. State its
uses.
(j) Describe the models of a time series.
Page 8
( PART : B—DESCRIPTIVE )
( Marks : 50 )
Answer four questions, taking at least one from each Group
GROUP—A
5. (a) Define the following : 1½×3=4½
(i) Mathematical expectation
(ii) Discrete random variable
(iii) Continuous random variable
(b) Show that E (a X ) = aE (X ). 3
(c) If the sum of the mean and variance of
a binomial distribution for 5 trials is 1·8,
then find the distribution. 5
6. (a) Define Poisson distribution and binomial
distribution. Mention three conditions under
which binomial distribution tends to Poisson
distribution. 1½+1½+3=6
(b) Suppose 8% of the people are left-handed.
What is the probability that 2 or more of
a random sample of 25 are left-handed? [Given,
e -2 = 0 × 135] 2½
Page 9
(c) If three persons on an average come to ABC
company for job interview, then find the
probability that less than three people have
come for interview on a given day. [Given,
e -3 = 0 × 0497] 4
GROUP—B
7. (a) What are index numbers? Explain their uses.
2+3=5
(b) Write a short note on the method of selection
of base period in the construction of an index
number. 2½
(c) From the following table, construct the
formulas of—
(i) Laspeyre’s index;
(ii) Paasche’s index. 2½×2=5
Item 2012 2017
Price Quantity Price Quantity
p 0i q 0i p1i q1i
A 4 20 6 10
B 3 15 5 20
C 2 25 3 15
D 5 10 4 40
Page 10
8. (a) What are different types of index number? 2
(b) From the data given below, construct the cost
of living index number : 4
Group Index number Weights
Food 250 45
Rent 150 15
Clothing 320 20
Fuel and lighting 190 5
Miscellaneous 300 15
(c) Explain various methods of measuring
trend and point out their relative merits and
demerits. 6½
GROUP—C
9. (a) Enumerate and explain various stages of
a sample survey. 6½
(b) Show that
s2 N - n
V (x ) SRSWOR = ×
n N
where x and s have usual meanings. 6
Page 11
10. (a) Suppose 4 units of a population are X 1 = 2,
X 2 = 4, X 3 = 6 and X 4 = 8. Draw all possible
samples of size 2 without replacement and
calculate their mean. Show that E (X ) = m.
Also find the variance of the estimate of the
population mean in case of—
(i) SRSWR of size 2;
(ii) SRSWOR of size 2. 2+3½+3=8½
(b) Write a note on stratified random sampling. 4
HHH
8K—50/46 HS/XII/A. Sc/S/18
Document Details
| Board / Org | Meghalaya Board |
| Exam | Class 12 |
| Type | Question Paper |
| Pages | 11 |
| Updated | 15 Jul 2026 |