MBOSE Class 11 Question Paper 2019 for Economics
Finished viewing? Save it for later —
Download MBOSE Class 11 Question Paper 2019 for Economics (PDF · 4 pages)About MBOSE Class 11 Question Paper 2019 for Economics
MBOSE Class 11 Question Paper 2019 for Economics is available here for free download. Published by Meghalaya Board for Class 11, this question paper can be viewed online or downloaded as a PDF (4 pages). Candidates preparing for Class 11 can use MBOSE Class 11 Question Paper 2019 for Economics to understand the exam pattern, the type of questions asked, and the overall difficulty level.
Frequently Asked Questions
How can I download MBOSE Class 11 Question Paper 2019 for Economics?
Open this page and click the Download button to save MBOSE Class 11 Question Paper 2019 for Economics as a PDF. It is completely free on AglaSem Docs.
Is MBOSE Class 11 Question Paper 2019 for Economics free to download?
Yes. MBOSE Class 11 Question Paper 2019 for Economics can be viewed online and downloaded as a PDF free of cost on AglaSem Docs.
How many pages does MBOSE Class 11 Question Paper 2019 for Economics have?
MBOSE Class 11 Question Paper 2019 for Economics contains 4 pages, which you can read online or download together as a single PDF.
Where can I find more Class 11 study material?
You can find more Class 11 question papers, sample papers, syllabus, and answer keys on AglaSem Docs.
MBOSE Class 11 Question Paper 2019 for Economics – Text
Read the full text of this question paper below — useful to quickly search, copy and reference the content online without downloading the PDF.
📄 View text version (4 pages)
Page 1
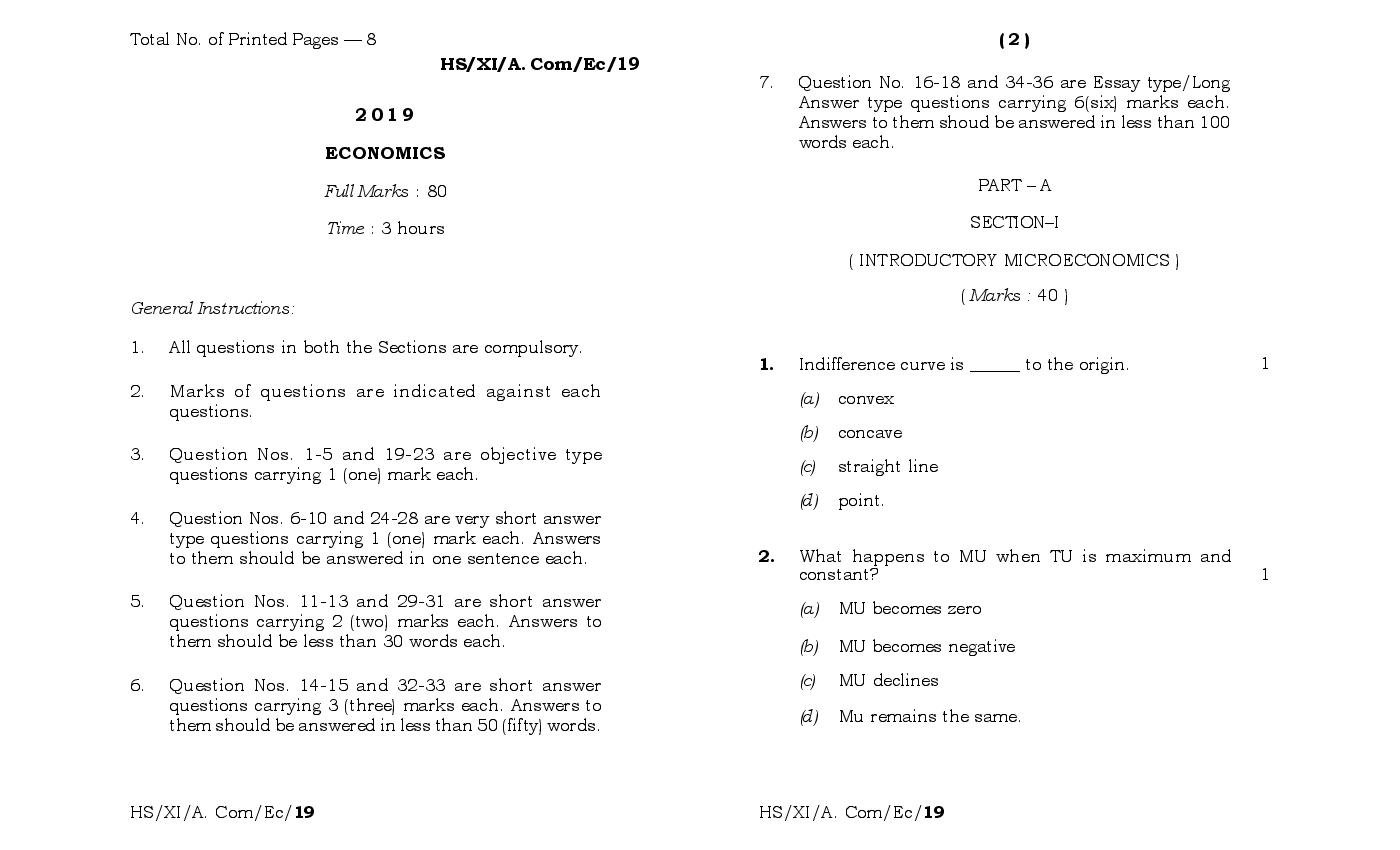
HS/XI/A. Com/Ec/19
7. Question No. 16-18 and 34-36 are Essay type/Long
Answer type questions carrying 6(six) marks each.
2019 Answers to them shoud be answered in less than 100
words each.
ECONOMICS
Full Marks : 80 PART – A
Time : 3 hours SECTION–I
( INTRODUCTORY MICROECONOMICS )
General Instructions:
1. All questions in both the Sections are compulsory.
1. Indifference curve is ______ to the origin. 1
2. Marks of questions are indicated against each (a) convex
questions.
(b) concave
3. Question Nos. 1-5 and 19-23 are objective type
(c) straight line
questions carrying 1 (one) mark each.
(d) point.
4. Question Nos. 6-10 and 24-28 are very short answer
type questions carrying 1 (one) mark each. Answers
to them should be answered in one sentence each. 2. What happens to MU when TU is maximum and
constant? 1
5. Question Nos. 11-13 and 29-31 are short answer (a) MU becomes zero
questions carrying 2 (two) marks each. Answers to
them should be less than 30 words each. (b) MU becomes negative
6. Question Nos. 14-15 and 32-33 are short answer (c) MU declines
questions carrying 3 (three) marks each. Answers to
(d) Mu remains the same.
them should be answered in less than 50 (fifty) words.
HS/XI/A. Com/Ec/19 HS/XI/A. Com/Ec/19
Page 2
3. Large number of buyers and sellers are the feature of 1 6. Define Average Revenue (AR). 1
(a) Monopoly
7. What is production function? 1
(b) Monopolistic competition
(c) Perfect competition
8. Draw an indifference curve. 1
(d) Oligopoly.
9. Define Monopoly market. 1
4. When total fixed cost of producing 10 units is 60/-,
the average fixed cost is 1 10. Mention the three basic problems of an Economy. 1
(a) 0.6
11. What are the properties of Indifference Curve? 2
(b) 6
(c) 60 12. State the law of demand. 2
(d) 600
13. Complete the following table 2
5. In case of a vertical demand curve, elasticity of demand No. of Units : 1 2 3 4
will be 1
Total Revenue ( ) : 5 – 15 –
(a) elastic
Average Revenue ( ) : – 5 – 5
(b) inelastic
(c) more elastic 14. Distinguish between centrally planned economy and
market economy. 3
(d) less elastic.
HS/XI/A. Com/Ec/19 HS/XI/A. Com/Ec/19
Page 3
15. With the help of a diagram, explain the increase and 20. Formula for finding mid-value is given by 1
decrease in supply. 3
(a) l2 l1
l2 l1
16. Explain with the help of a diagram the law of (b)
2
diminishing marginal utility. 6
(c) l1 l 2
l1 l 2
17. Explain Production Possibility Curve with the help of (d)
2
a diagram. 6
21. The range of the following series 80, 90, 100, is 1
18. Discuss the main features of a perfectly competitive
market. 6 (a) 10
(b) 20
PART – B
(c) 180
( STATISTICS FOR ECONOMICS )
(d) 270
19. According to tally bar method, which of the following 22. When a given series is divided into two equal parts
symbols indicate the frequency of five? 1 they are called 1
(a) ///// (a) percentile
(b) //// (b) decile
(c) //// (c) median
(d) // (d) quartile
HS/XI/A. Com/Ec/19 HS/XI/A. Com/Ec/19
Page 4
23. The other name of pie diagram is 1 32. What is statistics? Write a note on the importance of
statistics. 3
(a) Circular diagram
(b) Bar diagram
33. For the following data construct a Histogram and a
(c) Histogram frequency polygon 3
(d) Polygon Marks (x) : 30-40 40-50 50-60 60-70 70-80
Frequency (f) : 10 5 8 6 4
24. What are the two main sources of data? 1
34. Calculate arithmetic mean from the following data. 6
25. What is an open-end series? 1
Marks : 0-10 10-20 20-30 30-40
No. of Students: 5 10 25 30
26. Define mode. 1
27. Given the values as x1, x2, & x3. Write down the formula 35. Calculate quartiles from the following data. 3+3=6
for finding the Arithmetic Mean. 1 Wages ( ) Frequency (f)
0 – 10 22
28. What is correlation? 1 10 – 20 38
20 – 30 46
29. Distinguish between Sample and Census methods. 2
30 – 40 35
40 – 50 19
30. Distinguish between Univariate frequency distribution
and Bivariate frequency distribution. 2
36. Explain the importance of Index number in
31. Calculate the median of the following data. Economics. 6
11, 12, 8, 5, 9, 14, 20, 15, 13 2
HS/XI/A. Com/Ec/19 HS/XI/A. Com/Ec/19
Document Details
| Board / Org | Meghalaya Board |
| Exam | Class 11 |
| Type | Question Paper |
| Pages | 4 |
| Updated | 30 Apr 2026 |