AP Class 12 Model Paper 2027 Economics
Finished viewing? Save it for later —
Download AP Class 12 Model Paper 2027 Economics (PDF · 3 pages)About AP Class 12 Model Paper 2027 Economics
AP Class 12 Model Paper 2027 Economics is available here for free download. Published by Andhra Pradesh Board for Class 12, this document can be viewed online or downloaded as a PDF (3 pages). Candidates preparing for Class 12 can use AP Class 12 Model Paper 2027 Economics to understand the exam pattern, the type of questions asked, and the overall difficulty level.
Frequently Asked Questions
How can I download AP Class 12 Model Paper 2027 Economics?
Open this page and click the Download button to save AP Class 12 Model Paper 2027 Economics as a PDF. It is completely free on AglaSem Docs.
Is AP Class 12 Model Paper 2027 Economics free to download?
Yes. AP Class 12 Model Paper 2027 Economics can be viewed online and downloaded as a PDF free of cost on AglaSem Docs.
How many pages does AP Class 12 Model Paper 2027 Economics have?
AP Class 12 Model Paper 2027 Economics contains 3 pages, which you can read online or download together as a single PDF.
Where can I find more Class 12 study material?
You can find more Class 12 question papers, sample papers, syllabus, and answer keys on AglaSem Docs.
AP Class 12 Model Paper 2027 Economics – Text
Read the full text of this below — useful to quickly search, copy and reference the content online without downloading the PDF.
📄 View text version (3 pages)
Page 1
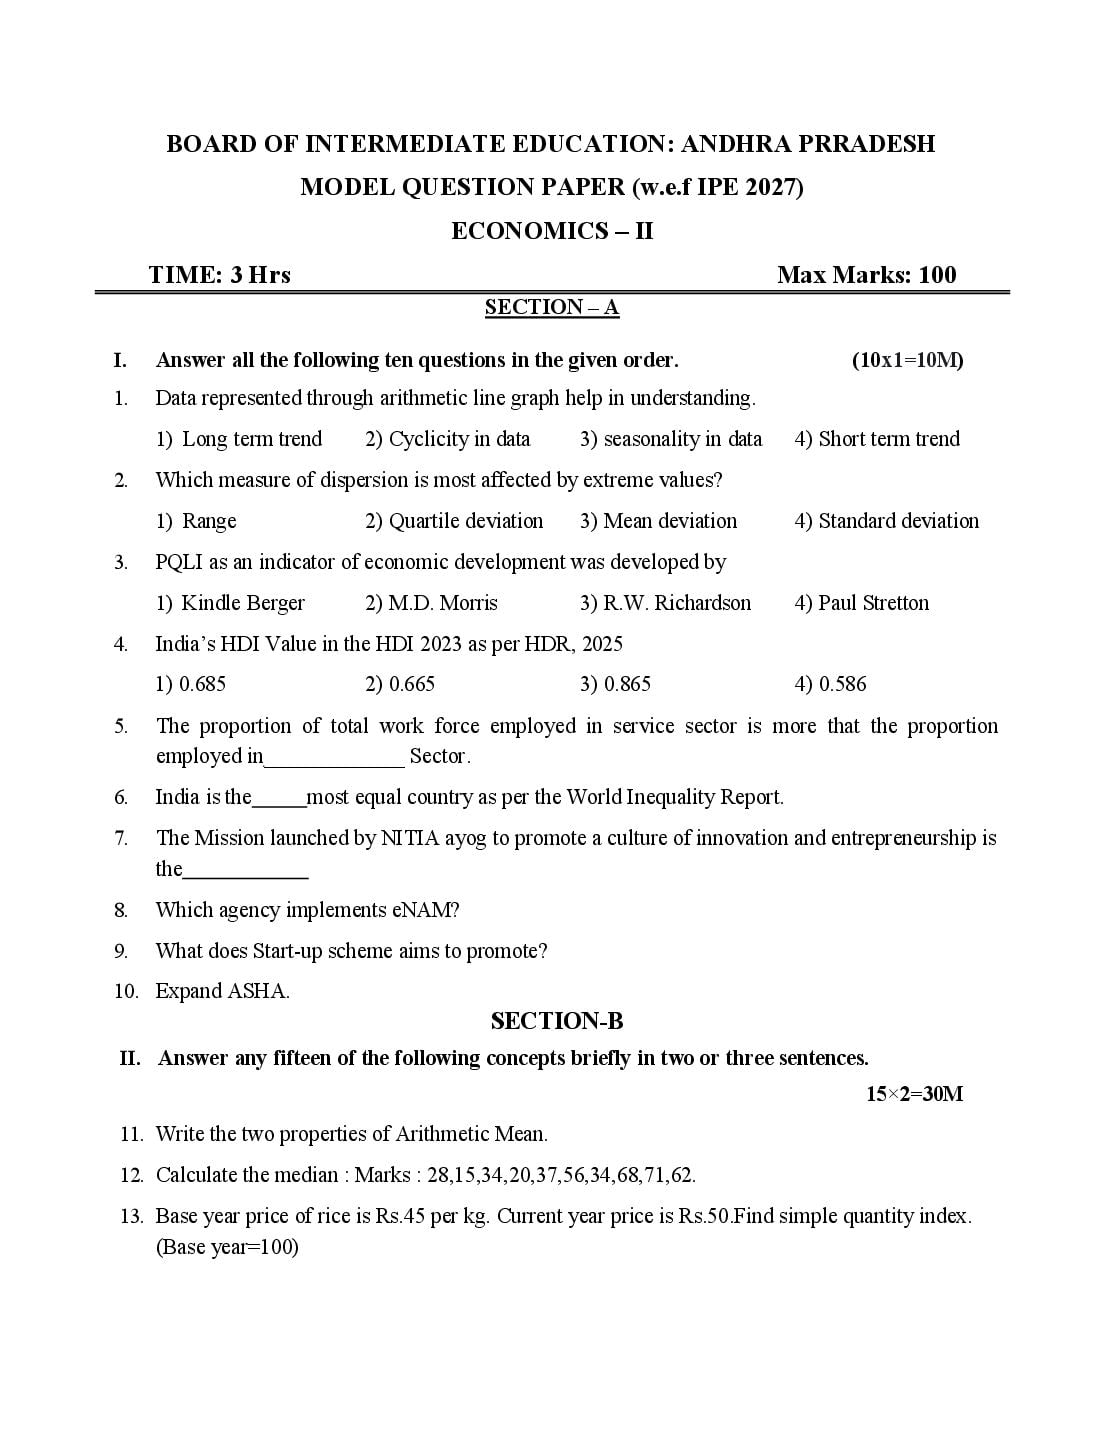
MODEL QUESTION PAPER (w.e.f IPE 2027)
ECONOMICS – II
TIME: 3 Hrs Max Marks: 100
SECTION – A
I. Answer all the following ten questions in the given order. (10x1=10M)
1. Data represented through arithmetic line graph help in understanding.
1) Long term trend 2) Cyclicity in data 3) seasonality in data 4) Short term trend
2. Which measure of dispersion is most affected by extreme values?
1) Range 2) Quartile deviation 3) Mean deviation 4) Standard deviation
3. PQLI as an indicator of economic development was developed by
1) Kindle Berger 2) M.D. Morris 3) R.W. Richardson 4) Paul Stretton
4. India’s HDI Value in the HDI 2023 as per HDR, 2025
1) 0.685 2) 0.665 3) 0.865 4) 0.586
5. The proportion of total work force employed in service sector is more that the proportion
employed in_____________ Sector.
6. India is the most equal country as per the World Inequality Report.
7. The Mission launched by NITIA ayog to promote a culture of innovation and entrepreneurship is
the
8. Which agency implements eNAM?
9. What does Start-up scheme aims to promote?
10. Expand ASHA.
SECTION-B
II. Answer any fifteen of the following concepts briefly in two or three sentences.
15×2=30M
11. Write the two properties of Arithmetic Mean.
12. Calculate the median : Marks : 28,15,34,20,37,56,34,68,71,62.
13. Base year price of rice is Rs.45 per kg. Current year price is Rs.50.Find simple quantity index.
(Base year=100)
Page 2
15. Deforestation.
16. State the definition of sustainable development given by Brundtland Report.
17. State the Drain Theory.
18. How do you describe India as an exporting economy? Give illustration.
19. What is GDI?
20. What is infant mortality rate?
21. Mixed modified recall period.
22. Distinguish between income poor and MPI poor?
23. National Investment Fund.
24. Gadgil formula
25. What is Pradhan Mantri Fasal Bima Yojana?
26. Define a major irrigation project.
27. State the objectives of Atma Nirbhar Bharat Abhiyan
28. Explain Maritime Waterways with examples.
29. Write any two schemes of school education in A.P.
30. Briefly mention the export potential of Andhra Pradesh
SECTION-C
III. Answer any nine out of the following fourteen questions. 9×4=36M
31. Explain clearly any four types of data presentation with suitable examples.
32. What is the criteria for an ideal measure of central tendency?
33. Calculate the standard deviation of the following data.
34. Discuss any four consequences of Economic Development on environment.
35. Explain any two types of pollution with their causes and effects.
36. Describe Indian economy during the British rule.
37. Explain Stage 2 of demographic
ographic transition.
Page 3
StatisticsandIndianEconomic
38. Describe key health indicators in India.
39. State the differences between planning commission and NITI Aayog.
40. Write about the types of land reforms implemented in Indian agriculture.
41. Comment on Make-in India P
Programme.
42. Explain the Importance of service sector in India.
43. List out four initiatives of AP industrial policy.
44. Examine the Govt. initiatives for agricultural sector development in Andhra Pradesh.
SECTION-D
IV. Answer any three of the following five questions. 3×8=24M
45. Calculate the Range, Coefficient of Range, and Quartile Deviation from the following data.
46. Justify India being called a developing economy with reference to the progress achieved.
47. What is meant by unemployment? Explain the causes of unemployment in India.
48. Discuss the measures taken under privatization as a part of economic reforms.
49. Explain the various agriculture allied activities in Indian economy.
* * *
Document Details
| Board / Org | Andhra Pradesh Board |
| Exam | Class 12 |
| Pages | 3 |
| Language | english |
| Updated | 24 Sep 2026 |