Karnataka 2nd PUC Model Question Paper 2027 for Statistics (Paper 3)
Finished viewing? Save it for later —
Download Karnataka 2nd PUC Model Question Paper 2027 for Statistics (Paper 3) (PDF · 4 pages)About Karnataka 2nd PUC Model Question Paper 2027 for Statistics (Paper 3)
Karnataka 2nd PUC Model Question Paper 2027 for Statistics (Paper 3) is available here for free download. Published by Karnataka Board for Class 12, this sample paper can be viewed online or downloaded as a PDF (4 pages). Candidates preparing for Class 12 can use Karnataka 2nd PUC Model Question Paper 2027 for Statistics (Paper 3) to understand the exam pattern, the type of questions asked, and the overall difficulty level.
Frequently Asked Questions
How can I download Karnataka 2nd PUC Model Question Paper 2027 for Statistics (Paper 3)?
Open this page and click the Download button to save Karnataka 2nd PUC Model Question Paper 2027 for Statistics (Paper 3) as a PDF. It is completely free on AglaSem Docs.
Is Karnataka 2nd PUC Model Question Paper 2027 for Statistics (Paper 3) free to download?
Yes. Karnataka 2nd PUC Model Question Paper 2027 for Statistics (Paper 3) can be viewed online and downloaded as a PDF free of cost on AglaSem Docs.
How many pages does Karnataka 2nd PUC Model Question Paper 2027 for Statistics (Paper 3) have?
Karnataka 2nd PUC Model Question Paper 2027 for Statistics (Paper 3) contains 4 pages, which you can read online or download together as a single PDF.
Where can I find more Class 12 study material?
You can find more Class 12 question papers, sample papers, syllabus, and answer keys on AglaSem Docs.
Karnataka 2nd PUC Model Question Paper 2027 for Statistics (Paper 3) – Text
Read the full text of this sample paper below — useful to quickly search, copy and reference the content online without downloading the PDF.
📄 View text version (5 pages)
Page 1
Karnataka 2nd PUC
Model Question Paper
2027 for Statistics
(Paper 3)
EXAM YEAR TYPE SUBJECT
Karnataka Class 12 2027 Sample Paper Statistics
Notes · Sample Papers · Previous Year Papers · Mock Tests
Page 2
m .co
m .co s e m
se g l a
` a
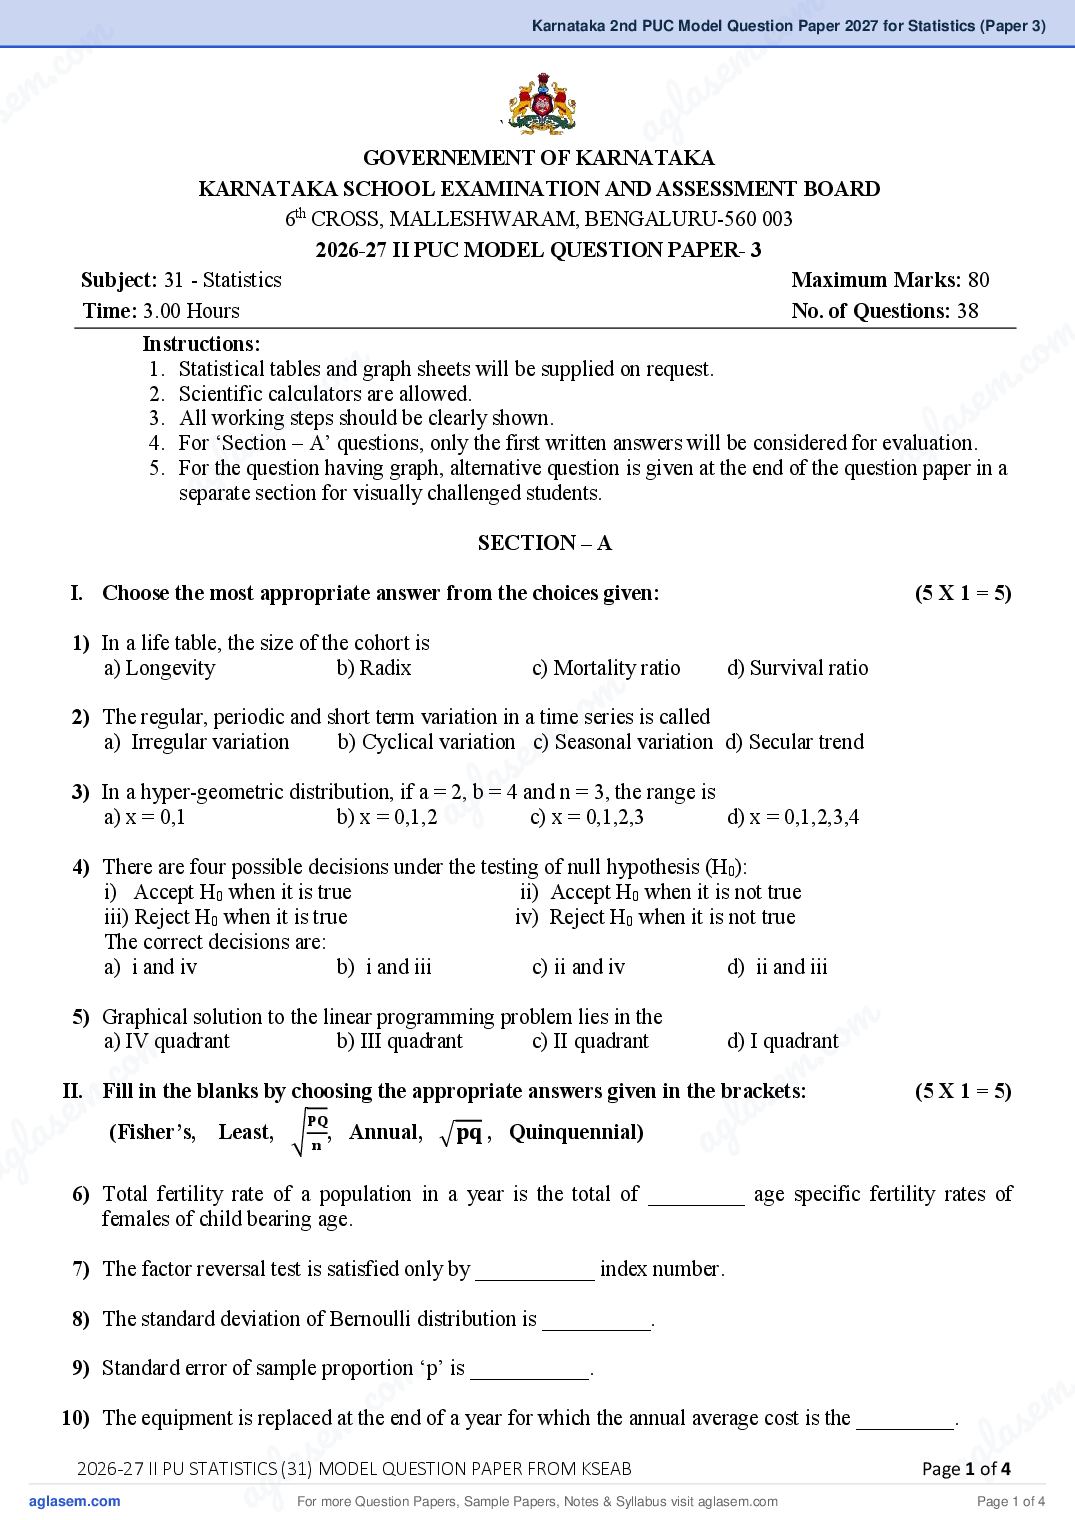
GOVERNEMENT OF KARNATAKA
KARNATAKA SCHOOL EXAMINATION AND ASSESSMENT BOARD
6th CROSS, MALLESHWARAM, BENGALURU-560 003
2026-27 II PUC MODEL QUESTION PAPER- 3
Subject: 31 - Statistics Maximum Marks: 80
Time: 3.00 Hours No. of Questions: 38
m
.co
Instructions:
m
.co
1. Statistical tables and graph sheets will be supplied on request.
e m
s
2. Scientific calculators are allowed.
e m
3. All working steps should be clearly shown.
l a
as
4. For ‘Section – A’ questions, only the first written answers will be considered for evaluation.
l ag
ag
5. For the question having graph, alternative question is given at the end of the question paper in a
separate section for visually challenged students.
SECTION – A
I. Choose the most appropriate answer from the choices given: (5 X 1 = 5)
1) In a life table, the size of the cohort is
a) Longevity b) Radix c) Mortality ratio d) Survival ratio
m
.co
2) The regular, periodic and short term variation in a time series is called
a) Irregular variation
em
b) Cyclical variation c) Seasonal variation d) Secular trend
s
3) In a hyper-geometric distribution, if a = 2, bl=a4 and n = 3, the range is
a) x = 0,1 b) x = 0,1,2 ag c) x = 0,1,2,3 d) x = 0,1,2,3,4
4) There are four possible decisions under the testing of null hypothesis (H0):
i) Accept H0 when it is true ii) Accept H0 when it is not true
iii) Reject H0 when it is true iv) Reject H0 when it is not true
The correct decisions are:
a) i and iv b) i and iii c) ii and iv d) ii and iii
5) Graphical solution to the linear programming problem lies in the
m
c o m
a) IV quadrant b) III quadrant c) II quadrant
m .co
d) I quadrant
m . s e
a
II. Fill in the blanks by choosing the appropriate answers given in the brackets: (5 X 1 = 5)
s e g l
a
𝐏𝐐
l (Fisher’s, Least, √ , Annual, √𝐩𝐪 , Quinquennial)
a
ag 6) Total fertility rate of a population in a year is the total of _________ age specific fertility rates of
𝐧
females of child bearing age.
7) The factor reversal test is satisfied only by ___________ index number.
8) The standard deviation of Bernoulli distribution is __________.
9) Standard error of sample proportion ‘p’ is ___________.
o m m .
c
. end of a year for which the annual average cost is the _________. se
m
10) The equipment is replaced at the
e l a
s
la MODEL QUESTION PAPER FROM KSEAB Pageag
g
2026-27 II PU STATISTICS (31) 1 of 4
a For more Question Papers, Sample Papers, Notes & Syllabus visit Page 1 of 4
Page 3
11) A B
a. N.R.R. per woman = 1.1 i. Inventory
b. Paasche’s index number ii. Population is increasing
c. Poisson distribution iii. Population is decreasing
d. Maximum size of the test iv. Downward bias
e. Physical stock of goods v. Level of significance
vi. Mean = variance
IV. Answer the following questions: (5 X 1 = 5)
12) Mention one of the characteristics of index numbers.
13) Write the median of a t-distribution.
14) Define point estimation.
15) Which type of ‘cause of variation’ is detected by statistical quality control?
16) Write the formula of to-date annual average cost in a replacement problem.
SECTION – B
V. Answer any FIVE of the following questions: (5 X 2 = 10)
17) State two conditions of least squares method of measuring trend.
18) Define ‘interpolation’ and ‘extrapolation’.
19) Find the mean of a hyper-geometric distribution with parameters a = 6, b = 4 and n = 5.
20) Find the variance of a chi-square distribution with 8 degrees of freedom.
21) Define: ‘type – I error’ and ‘ type – II error’.
22) If (x̅1– x̅2) = 2.6 and S.E.( x̅1 – x̅2 ) = 1.3, find the value of test statistic Z.
23) If P ′ = 0.1 and n = 100, calculate the upper control limit for d-chart.
24) If Q0 = 300 units, C1 = Rs 10/unit/year and C2 = Rs 40/unit/year, then find the maximum inventory level.
SECTION – C
VI. Answer any FOUR of the following questions: (4 X 5 = 20)
25) Calculate Kelly’s price index number for the following data and comment on the result.
Items Price (in Rs) No. of units
2019 2024 sold
A 21 27 10
B 30 40 15
C 15 23 12
D 40 37 20
26) Interpolate and extrapolate the profit for the years 2019 and 2025 by using binomial expansion method
from the following data.
Year 2015 2017 2019 2021 2023 2025
Profit (Cr Rs) 8 14 - 21 30 -
2026-27 II PU STATISTICS (31) MODEL QUESTION PAPER FROM KSEAB Page 2 of 4
For more Question Papers, Sample Papers, Notes & Syllabus visit Page 2 of 4
Page 4
m .co
c.27)o In a college, 60% of the students are girls. In a random sample of 5 students,
s e m find the probability of
m getting (i) 3 girls, (ii) at least one girl. la
se a g
28) On an average a telephone operator receives 4 telephone calls per 10 minutes interval. Find the
probability that in a particular 10 minutes interval he
(i) does not receive any calls
(ii) receives more than 2 calls.
29) The standard deviation of production of wheat is assumed to be 10.2. A sample of 25 acres showed that
the standard deviation is 8.2. Test at 1% level of significance whether the standard deviation of
production of wheat is less than 10.2.
o m
m . c
. co solution
30) Obtain an initial basic feasible
e
for the following transportation problem by matrix-minima
s
m
em a
method. Find the total transportation cost.
as To Supply
g l
l a
agO
D 1 D 2 D 3 D 4
1 15 3 7 14 80
From O2 5 6 10 12 70
O3 4 11 8 9 50
Demand 25 45 40 90
31) Solve the following game by using dominance principle. Is the game fair?
Player – B
B1 B2 B3
m
.co
A1 -2 6 7
A2 0 5 4
e m
Player – A A3 -5 3 8
la s
g
A4 -6 0 9
a
VII. Answer any TWO of the following questions: (2 X 5 = 10)
32) Marks scored by the students of a class follow normal distribution with mean 60 and standard deviation
6 marks. Find the probability that a student selected at random from the class scored
(i) more than 75 marks (ii) between 54 and 66 marks.
33) Following is the data regarding five students administered for an I.Q. test before and after treatment of
m
yoga.
m .co
I.Q. before yoga 120 116 118 125 115
.co
I.Q. after yoga 118 125 125 130
mIs yoga treatment effective in improving I.Q.? (Use 5% level of significance).s e 120 m
s e g l a
l a a
ag 34) Calculate the control limits for ̅X - chart when ̅X = 30, R̅ = 20 and n = 4.
35) Solve the following linear programming problem graphically:
Minimize Z = 10x + 15y
Subject to constraints: 4x + 3y ≥ 24
4x + 5y ≤ 40
and x, y ≥ 0
m .
m .co s e m
s e l a
3g
g la MODEL QUESTION PAPER FROM KSEAB
2026-27 II PU STATISTICS (31) Pagea of 4
a For more Question Papers, Sample Papers, Notes & Syllabus visit Page 3 of 4
Page 5
VIII. Answer any TWO of the following questions: (2 X 10 = 20)
36) Compute the standardized death rates from the following data and find which locality is more healthier.
Age group Standard Locality – A Locality – B
(in years) population Population Deaths Population Deaths
0 – 10 2000 4000 36 3000 27
10 – 40 16000 12000 120 20000 240
40 – 60 5000 6000 78 4000 56
60 & above 7000 8000 168 3000 60
37) a) Calculate the value index number for the following data and comment on the result. (05)
Item 2018 2024
Price (in Rs) Quantity Price (in Rs) Quantity
A 40 10 50 11
B 30 12 40 13
C 25 14 30 16
D 12 15 16 16
b) Compute the consumer price index number by using family budget method for the following data. (05)
Group Price (in Rs) Weight
Base year Current year
Food 4000 5000 20
Housing 3000 3600 25
Clothing 1500 1635 10
Fuel 2000 2600 15
Other 3500 4900 20
38) Fit an exponential curve of the type y = abx for the following time series data and estimate the value for
the year 2025.
Year 2020 2021 2022 2023 2024
Value 15 27 79 177 205
SECTION - E
(For Visually challenged students only)
35) Write the procedure of solving linear programming problem graphically.
***
2026-27 II PU STATISTICS (31) MODEL QUESTION PAPER FROM KSEAB Page 4 of 4
For more Question Papers, Sample Papers, Notes & Syllabus visit Page 4 of 4
Document Details
| Board / Org | Karnataka Board |
| Exam | Class 12 |
| Type | Sample Paper |
| Pages | 4 |
| Language | english |
| Updated | 03 Nov 2026 |