Karnataka 1st PUC Model Question Paper 2023 for Statistics
Finished viewing? Save it for later —
Download Karnataka 1st PUC Model Question Paper 2023 for Statistics (PDF · 5 pages)About Karnataka 1st PUC Model Question Paper 2023 for Statistics
Karnataka 1st PUC Model Question Paper 2023 for Statistics is available here for free download. Published by Karnataka Board for Class 11, this sample paper can be viewed online or downloaded as a PDF (5 pages). Candidates preparing for Class 11 can use Karnataka 1st PUC Model Question Paper 2023 for Statistics to understand the exam pattern, the type of questions asked, and the overall difficulty level.
Frequently Asked Questions
How can I download Karnataka 1st PUC Model Question Paper 2023 for Statistics?
Open this page and click the Download button to save Karnataka 1st PUC Model Question Paper 2023 for Statistics as a PDF. It is completely free on AglaSem Docs.
Is Karnataka 1st PUC Model Question Paper 2023 for Statistics free to download?
Yes. Karnataka 1st PUC Model Question Paper 2023 for Statistics can be viewed online and downloaded as a PDF free of cost on AglaSem Docs.
How many pages does Karnataka 1st PUC Model Question Paper 2023 for Statistics have?
Karnataka 1st PUC Model Question Paper 2023 for Statistics contains 5 pages, which you can read online or download together as a single PDF.
Where can I find more Class 11 study material?
You can find more Class 11 question papers, sample papers, syllabus, and answer keys on AglaSem Docs.
Karnataka 1st PUC Model Question Paper 2023 for Statistics – Text
Read the full text of this sample paper below — useful to quickly search, copy and reference the content online without downloading the PDF.
📄 View text version (5 pages)
Page 1
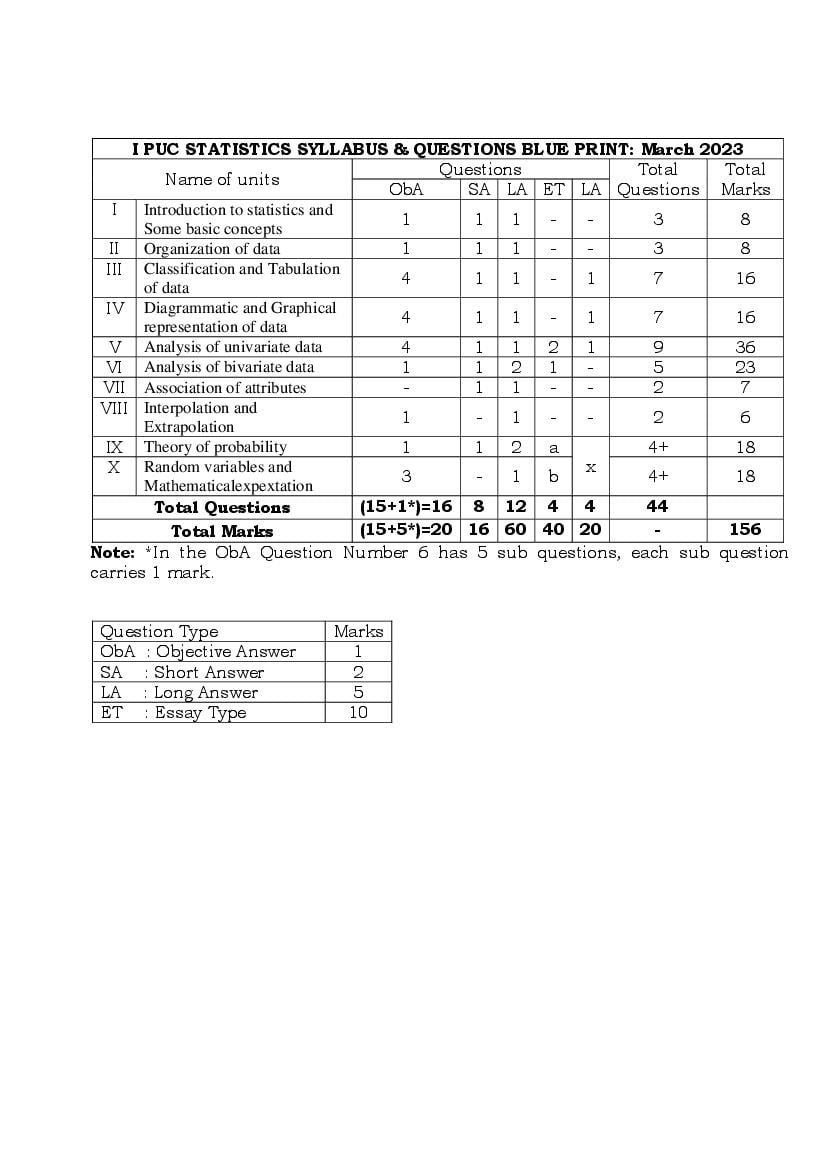
Questions Total Total
Name of units
ObA SA LA ET LA Questions Marks
I Introduction to statistics and
1 1 1 - - 3 8
Some basic concepts
II Organization of data 1 1 1 - - 3 8
III Classification and Tabulation
4 1 1 - 1 7 16
of data
IV Diagrammatic and Graphical
4 1 1 - 1 7 16
representation of data
V Analysis of univariate data 4 1 1 2 1 9 36
VI Analysis of bivariate data 1 1 2 1 - 5 23
VII Association of attributes - 1 1 - - 2 7
VIII Interpolation and
1 - 1 - - 2 6
Extrapolation
IX Theory of probability 1 1 2 a 4+ 18
X Random variables and x
3 - 1 b 4+ 18
Mathematicalexpextation
Total Questions (15+1*)=16 8 12 4 4 44
Total Marks (15+5*)=20 16 60 40 20 - 156
Note: *In the ObA Question Number 6 has 5 sub questions, each sub question
carries 1 mark.
Question Type Marks
ObA : Objective Answer 1
SA : Short Answer 2
LA : Long Answer 5
ET : Essay Type 10
Page 2
Model Paper (March - 2023)
[Total No. of Questions: 44] Subject: STATISTICS Class: I P.U.C
Time: 3 Hrs. 15 Min. Max. Marks: 100
Note: (1) Graph sheets and statistical tables will be supplied on request.
(2) Scientific calculators may be allowed.
(3) All working steps should be shown clearly.
(4) Section – A should be written in the beginning of the answer booklet.
SECTION – A
I. Choose the correct answer. (5 X 1 = 5)
1) Which of the following statement is false?
a) Statistics is derived from the Latin word ‘Status’
b) Statistics is derived from the Italian word ‘Statista’
c) Statistics is derived from the French word ‘Statistik’
d) None of these
2) ‘Stub’ of a table is the
a) Left part of the table describing the columns
b) Right part of the table describing the columns
c) Right part of the table describing the rows
d) Left part of the table describing the rows
3) Multiple bar diagram is a type of,
a) One dimensional diagram b) Two dimensional diagram
c) Three dimensional diagram d) Cartograms
4) GM of 8, 4, 2 is,
a) 4 b) 2 c) 8 d) 6
5) If a and b are constants then V(aX +b) is equal to
a) a V(X) b) a2 V(X) c) a2 V(X) + b d) None of these
II. Match the following. (5 X 1 = 5)
6)
(i) Direct personal observation (a) H – L .
(ii) 10 – 20 (b) Primary data.
(iii) Cumulative frequency distribution (c) mid-point is 5.
(iV) Range (d) Perfect positive correlation.
(V) In the rank correlation ∑d2 = 0 (e) Less than ogive.
Page | 1
Page 3
(Histogram, Bell, 36, 0, open-end)
7) In a class, if the lower or upper limit of the class is not specified such a class is called ______________
class.
8) Mode can be obtained graphically by using _____________.
9) When the symmetric distribution is plotted on a graph, we get a _______ shaped curve.
10) In interpolation of binomial expansion method, (y-1)n = ________.
11) In throwing ‘2’ dice, total number of possible outcomes is _____________.
IV. Answer the following questions. (5 X 1 = 5)
12) Define frequency.
13) Mention a need of diagram.
14) If SD = 4 cms, find variance.
15) What is the value of E(8), if 8 is a constant.
16) Define discrete random variable.
SECTION – B
V. Answer any FIVE of the Questions. (5 X 2 =10)
17) Mention two functions of Statistics.
18) Mention two causes of sampling errors.
19) Mention the four types of classification.
20) Mention the limitations of diagrams and graphs.
21) The arithmetic mean and median of a slightly skewed distribution are 11 cm and 11.7 cm respectively.
Find the mode of the distribution.
22) If bxy = 0.75 and byx = 0.33 then find xy.
23) What is the difference between coefficient of correlation and association of attributes?
24) If A and B are two independent events and P(A) = 0.6, P(B) = 0.5, then find P(AꓴB).
SECTION – C
VI. Answer any EIGHT of the following questions. (8 x 5 = 40)
25) Mention five characteristics of Statistics.
26) Distinguish between census enumeration and sample survey.
27) Weights in kg of 50 students of a college are as follows.
42 62 46 54 41 37 54 44 32 45
47 50 58 49 51 42 46 37 42 39
54 39 51 58 47 64 43 48 49 48
49 61 41 40 58 49 59 57 37 34
56 38 45 52 46 40 63 41 51 41
Prepare a frequency distribution table with suitable class intervals.
Page | 2
Page 4
Year 1971 1981 1991 2001 2011
Population(Million) 54 68 84 102 120
29) Compute M.D from mode for the data given below:
x 24 26 28 30 32 34
f 6 10 16 8 3 2
30) Calculate Pearson’s coefficient of correlation from the following data.
x 40 42 46 48 50 56
y 10 12 15 23 27 30
31) In a bivariate data, ∑x = 30, ∑y = 40, ∑xy = 85, ∑x2 = 196, ∑y2 = 465 and n = 10. Estimate the value of
y, when the value of x = 5.
32) Compute Yule’s coefficient of Association from the following data.
(AB) = 150, N = 1000, (A) = 200, (B) = 300.
33) From the following data interpolate the production of cement in 2007.
Year 2005 2006 2007 2008 2009 2010
Production (lakh tons) 4 9 ? 16 27 39
34) State and prove addition theorem of probability for two non – mutually exclusive events.
35) A box contains 6 white, 4 black and 5 green balls. Three balls are drawn at random from this box. Find
the probability that they are:
(a) two white and one black balls (b) one white and two are green balls.
36) State and prove multiplication theorem of expectation for two independent random variables X and Y.
SECTION- D
VII. Answer any TWO of the following questions. (2 x 10 = 20)
37) The number of runs scored by two batsmen A and B in different innings is as follows :
A 12 115 6 73 7 19 119 36 84 29
B 47 12 76 42 4 51 37 48 13 0
Who is better run scorer? Who is more consistent?
38) Calculate Bowley’s coefficient of skewness from the data given below.
C.I. 0 – 15 15 – 30 30 – 45 45 – 60 60 – 75
f 31 38 16 10 5
Page | 3
Page 5
y
x
80 – 90 90 - 100 100 - 110 110 - 120
40 - 44 - 2 4 2
44 - 48 2 3 4
48 - 52 4 5 1
52 - 56 2 6 4
56 - 60 3 4 1
40) a) Contents of two boxes are as follows:-
I box: 2 white and 4 black marbles
II box: 3 white and 5 black marbles.
One of the marble is selected from the bag. What is the probability that it is white in colour
b) A random variable assumes the values -1, 0 and 1 with probabilities 0.2, 0.7 and 0.1 respectively.
Find E(2X).
SECTION – E
VIII. Answer any TWO of the Questions. (2 X 5 = 10)
41) Prepare a blank table to show the distribution of students according to
i. College: Government, Aided, Unaided.
ii. Faculty: Science, Commerce, Arts.
iii. Gender: Boys, Girls.
42) Draw less than Ogive to the following frequency distribution.
Class 20 – 25 25 – 30 30 – 35 35 – 40 40 – 45 45 - 50
Frequency 17 25 40 23 12 8
43) The mean and standard deviation of a distribution of 100 and 150 items are 50, 5 and 40, 6
respectively. Find the standard deviation of all the 250 items taken together.
44) A box contains 8 items of which 2 are defective. A man selects 3 items. Find the expected number of
defective items in the selection.
***
Page | 4
Document Details
| Board / Org | Karnataka Board |
| Exam | Class 11 |
| Type | Sample Paper |
| Pages | 5 |
| Updated | 30 Apr 2026 |