TBSE Class 11 Syllabus 2025 Statistics
Finished viewing? Save it for later —
Download TBSE Class 11 Syllabus 2025 Statistics (PDF · 3 pages)About TBSE Class 11 Syllabus 2025 Statistics
TBSE Class 11 Syllabus 2025 Statistics is available here for free download. Published by Tripura Board for Class 11, this syllabus can be viewed online or downloaded as a PDF (3 pages). Candidates preparing for Class 11 can use TBSE Class 11 Syllabus 2025 Statistics to understand the exam pattern, the type of questions asked, and the overall difficulty level.
Frequently Asked Questions
How can I download TBSE Class 11 Syllabus 2025 Statistics?
Open this page and click the Download button to save TBSE Class 11 Syllabus 2025 Statistics as a PDF. It is completely free on AglaSem Docs.
Is TBSE Class 11 Syllabus 2025 Statistics free to download?
Yes. TBSE Class 11 Syllabus 2025 Statistics can be viewed online and downloaded as a PDF free of cost on AglaSem Docs.
How many pages does TBSE Class 11 Syllabus 2025 Statistics have?
TBSE Class 11 Syllabus 2025 Statistics contains 3 pages, which you can read online or download together as a single PDF.
Where can I find more Class 11 study material?
You can find more Class 11 question papers, sample papers, syllabus, and answer keys on AglaSem Docs.
TBSE Class 11 Syllabus 2025 Statistics – Text
Read the full text of this syllabus below — useful to quickly search, copy and reference the content online without downloading the PDF.
📄 View text version (3 pages)
Page 1
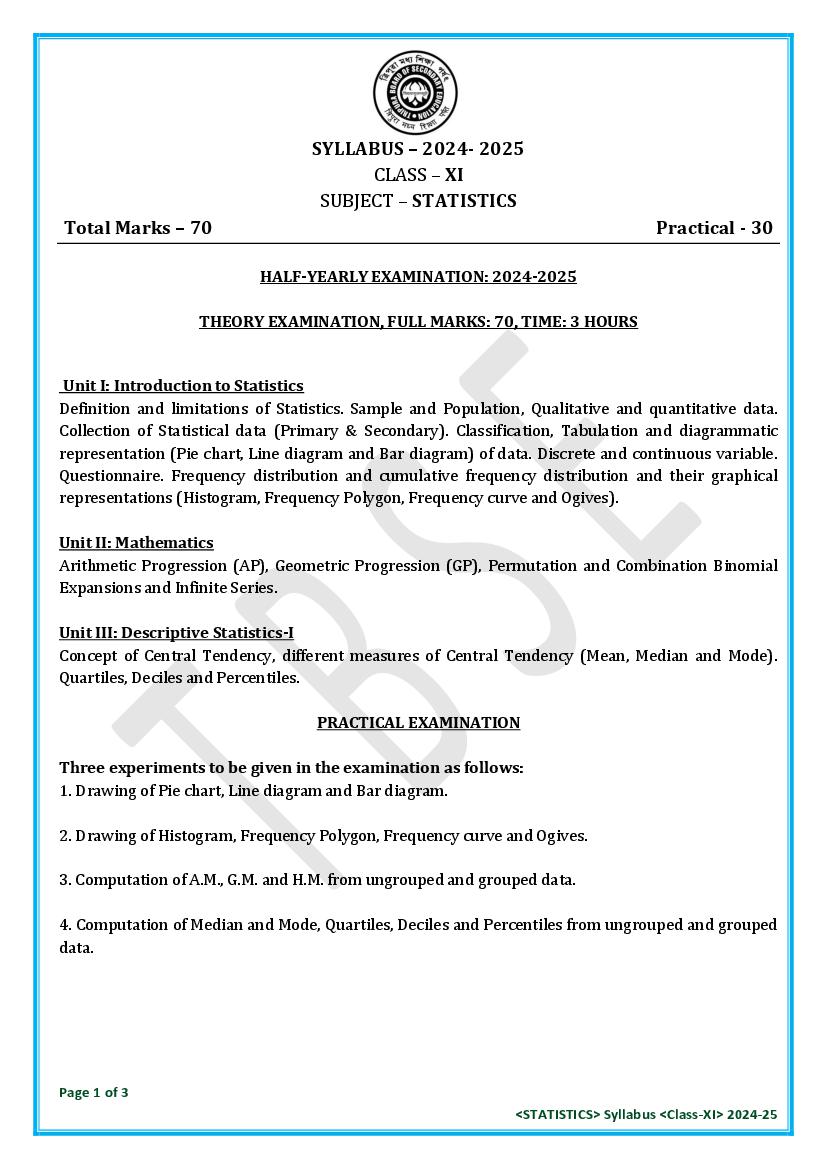
CLASS – XI
SUBJECT – STATISTICS
Total Marks – 70 Practical - 30
HALF-YEARLY EXAMINATION: 2024-2025
Unit I: Introduction to Statistics
Definition and limitations of Statistics. Sample and Population, Qualitative and quantitative data.
Collection of Statistical data (Primary & Secondary). Classification, Tabulation and diagrammatic
representation (Pie chart, Line diagram and Bar diagram) of data. Discrete and continuous variable.
Questionnaire. Frequency distribution and cumulative frequency distribution and their graphical
representations (Histogram, Frequency Polygon, Frequency curve and Ogives).
Unit II: Mathematics
Arithmetic Progression (AP), Geometric Progression (GP), Permutation and Combination Binomial
Expansions and Infinite Series.
Unit III: Descriptive Statistics-I
Concept of Central Tendency, different measures of Central Tendency (Mean, Median and Mode).
Quartiles, Deciles and Percentiles.
1. Drawing of Pie chart, Line diagram and Bar diagram.
2. Drawing of Histogram, Frequency Polygon, Frequency curve and Ogives.
3. Computation of A.M., G.M. and H.M. from ungrouped and grouped data.
4. Computation of Median and Mode, Quartiles, Deciles and Percentiles from ungrouped and grouped
data.
Page 1 of 3
Page 2
Unit III: Descriptive Statistics-2
Concept of Dispersions, different measures of dispersions (Range, Quartile deviation, Mean deviation
and Standard deviation), Relative measures of dispersions.
Moments, Sheppard’s correction for moments (without proof), Skewness and Kurtosis and their
measures based on moments and quartiles.
Unit IV: Time Series
Definition of Time Series, Different Components of Time Series, Different models involve in Time
Series, Calculation of Trends by different methods (graphical method, method of semi average,
method of moving average and method of least squares) with advantages and disadvantages.
Calculation of seasonal components by different methods (method of simple average, ratio to trend
and ratio to moving average) with advantages and disadvantages.
1. Computation of Range, Quartile deviation, Mean deviation, Standard deviation and coefficient of
variation from ungrouped and grouped data.
2. Computation of different measures of Skewness and Kurtosis from ungrouped and grouped data.
3. Computation of trend by method of semi average, moving average and by method of least squares.
4. Computation of seasonal component by method of simple average, ratio to trend and ratio to
moving average.
BLUE-PRINT OF DISTRIBUTION OF MARKS
HALF-YEARLY/ ANNUAL EXAMINATION: 2024-2025
Very Short Answer (VSA) 15 Questions x 2 Marks 15x2 = 30
Short Answer (SA) 5 Questions x 3 Marks 5x3 = 15
Long Answer (LA) 5 Questions x 5 Marks 5x5 = 25
Total 70
BLUE-PRINT OF DISTRIBUTION OF MARKS (PRACTICAL)
HALF-YEARLY/ ANNUAL EXAMINATION: 2024-2025
1. Experiments (5+5+10) 20 Marks
2. Practical Note Book (PNB) 3 Marks
3. Viva-voce 2 Marks
4. Attendance 5 Marks
Total 30 Marks
Page 2 of 3
Page 3
Type of Questions Marks (70) Percentage
1. Very Short Answer Type Questions (VSA) (2x15)
30 42.86
(Inclusive of Assertion, Reason, Differentiation & Stem)
2. Short Answer Type Questions (SA) (3x5)
(Knowledge, Understanding, Application, Analysis, Evaluation, 15 21.43
Synthesis & Create)
3. Long Answer Type Questions (LA) (5×5)
(Knowledge, Understanding, Application, Analysis, Evaluation, 25 35.71
Synthesis & Create)
70 100
NOTE:-
i) Typology of questions:- MCQ, VSA, Assertion- Reasoning type questions; SA-I, SA-II, LA-I,
LA-II, LA- III.
In LA- type questions source-based/ case- study based/ passage based questions may be
included.
ii) Approximately 33 % internal choice would be given.
Page 3 of 3