Karnataka 1st PUC Model Question Paper 2022 for Statistics
Finished viewing? Save it for later —
Download Karnataka 1st PUC Model Question Paper 2022 for Statistics (PDF · 5 pages)About Karnataka 1st PUC Model Question Paper 2022 for Statistics
Karnataka 1st PUC Model Question Paper 2022 for Statistics is available here for free download. Published by Karnataka Board for Class 11, this sample paper can be viewed online or downloaded as a PDF (5 pages). Candidates preparing for Class 11 can use Karnataka 1st PUC Model Question Paper 2022 for Statistics to understand the exam pattern, the type of questions asked, and the overall difficulty level.
Frequently Asked Questions
How can I download Karnataka 1st PUC Model Question Paper 2022 for Statistics?
Open this page and click the Download button to save Karnataka 1st PUC Model Question Paper 2022 for Statistics as a PDF. It is completely free on AglaSem Docs.
Is Karnataka 1st PUC Model Question Paper 2022 for Statistics free to download?
Yes. Karnataka 1st PUC Model Question Paper 2022 for Statistics can be viewed online and downloaded as a PDF free of cost on AglaSem Docs.
How many pages does Karnataka 1st PUC Model Question Paper 2022 for Statistics have?
Karnataka 1st PUC Model Question Paper 2022 for Statistics contains 5 pages, which you can read online or download together as a single PDF.
Where can I find more Class 11 study material?
You can find more Class 11 question papers, sample papers, syllabus, and answer keys on AglaSem Docs.
Karnataka 1st PUC Model Question Paper 2022 for Statistics – Text
Read the full text of this sample paper below — useful to quickly search, copy and reference the content online without downloading the PDF.
📄 View text version (5 pages)
Page 1
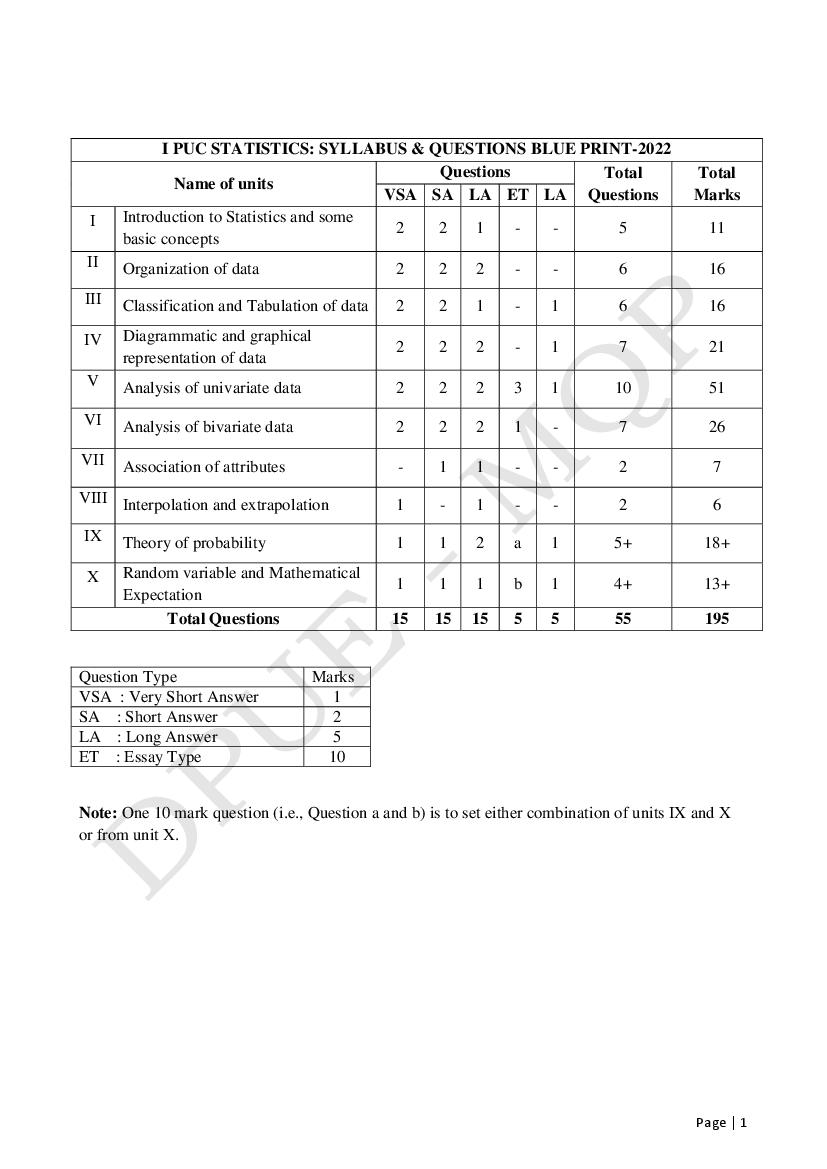
Questions Total Total
Name of units
VSA SA LA ET LA Questions Marks
I Introduction to Statistics and some
2 2 1 - - 5 11
basic concepts
II Organization of data 2 2 2 - - 6 16
III Classification and Tabulation of data 2 2 1 - 1 6 16
IV Diagrammatic and graphical
2 2 2 - 1 7 21
representation of data
V Analysis of univariate data 2 2 2 3 1 10 51
VI Analysis of bivariate data 2 2 2 1 - 7 26
VII Association of attributes - 1 1 - - 2 7
VIII Interpolation and extrapolation 1 - 1 - - 2 6
IX Theory of probability 1 1 2 a 1 5+ 18+
X Random variable and Mathematical
1 1 1 b 1 4+ 13+
Expectation
Total Questions 15 15 15 5 5 55 195
Question Type Marks
VSA : Very Short Answer 1
SA : Short Answer 2
LA : Long Answer 5
ET : Essay Type 10
Note: One 10 mark question (i.e., Question a and b) is to set either combination of units IX and X
or from unit X.
Page | 1
Page 2
MODEL QUESTION PAPER - 2022
I PUC
SUBJECT: STATISTICS (31)
[Total No. of questions: 55]
Time: 3Hrs. 15Mins. Max. Marks: 100
Note: 1. Statistical table and graph sheets will be supplied on request.
2. Scientific calculators may be used.
3. All working steps should be clearly shown.
Section – A
I. Answer any ten of the following questions. 10 × 1 = 10
1. Give Boddington’s definition of Statistics.
2. Define an attribute.
3. What is meant by statistical enquiry?
4. Define sampling.
5. Define frequency.
6. What is tabulation of the data?
7. Mention a type of one dimensional diagram.
8. Name the graph used to locate median.
9. Find mode for the following data: 3, 4, 5, 5, 6, 8, 5, 7, 5, 5, 8, 5, 5, 4, 5.
10. If SD = 4 cms, find variance.
11. What is causation?
12. Write the co-ordinates of the point of intersection of the two regression equation.
13. What is interpolation?
14. Write the sample space when two coins are tossed once.
15. What is the value of E(8), if 8 is a constant.
Section – B
II. Answer any ten of the following questions. 10 × 2 = 20
16. Mention two functions of Statistics.
17. What is meant by nominal and ordinal scales?
18. Mention the sources of secondary data.
19. Write two causes of sampling errors.
20. Write down the types of classification.
21. Find frequency density for the following data.
C.I 0 – 10 10 – 30 30- 50 50 – 60
f 10 25 40 15
Page | 2
Page 3
23. Write down the two limitations of diagrams and graphs?
24. If sum of 15 observations is 450. Find its mean.
25. For the following data compute coefficient of range.
Height (cms): 160, 158, 159, 165, 148, 139, 142, 155.
26. Draw a scatter diagram to show that there exists perfect negative correlation between two
variables.
27. Prove that √
28. What is the difference between coefficient of correlation and association of attributes?
29. If A and B are two independent events and P(A) = 0.6, P(B) = 0.5, then find P(A∪B).
30. If E(X) = 5 and E(X2) = 36, find SD(X).
Section – C
III. Answer any eight of the following questions. 8 × 5 = 40
31. Mention five characteristics of Statistics.
32. Distinguish between census enumeration and sample survey.
33. Mention the methods of samping and explain one of them.
34. Weights in kg of 50 students of a college are as follows.
42 62 46 54 41 37 54 44 32 45
47 50 58 49 51 42 46 37 42 39
54 39 51 58 47 64 43 48 49 48
49 61 41 40 58 49 59 57 37 34
56 38 45 52 46 40 63 41 51 41
Prepare a frequency distribution table with suitable class intervals.
35. Following figures represent the decadal change of population of India. Draw a simple bar
diagram.
Year 1971 1981 1991 2001 2011
Population(Million) 548 688 846 1028 1210
36. Prepare a histogram from the following data :
C.I 0-6 6-12 12-18 18-30 30-36 36-42
f 4 8 15 20 12 2
37. Calculate the harmonic mean from the following data.
X 10 20 30 40 50
f 2 4 6 5 3
38. Compute M.D from median for the data given below:
X 24 26 28 30 32 34
f 6 10 16 8 3 2
Page | 3
Page 4
X 40 42 46 48 50 56
Y 10 12 15 23 27 30
40. Following are the marks of 8 students in Statistics and Mathematics. Find coefficient of rank
correlation.
Marks in Statistics 25 43 27 35 54 61 37 45
Marks in Mathematics 35 47 20 37 63 54 28 40
41. Compute Yule’s coefficient of Association from the following data.
(AB) = 150, N = 1000, (A) = 200, (B) = 300.
42. From the following data interpolate the production of cement in 2007.
Year 2005 2006 2007 2008 2009 2010
Production (in tons) 44 90 ? 160 270 390
43. State and prove addition theorem of probability for two mutually exclusive events.
44. A box contains 6 white and 4 black marbles. Three marbles are drawn at random from this box.
Find the probability that they are:
(a) two white and one black marbles. (b) one white and two are black marbles.
45. State and prove multiplication theorem of expectation for two independent random variables X
and Y.
Section – D
IV. Answer any two of the following questions. 2 × 10 = 20
46. Find mean and mode for the following distribution.
C.I 0 – 10 10 – 20 20 – 30 30 – 40 40 – 50
f 12 18 25 15 5
47. The number of runs scored by two batsmen A and B in different innings is as follows :
A 12 115 6 73 7 19 119 36 84 29
B 47 12 76 42 4 51 37 48 13 0
Who is better run scorer? Who is more consistent?
48. Calculate Bowley’s coefficient of skewness from the data given below.
C.I. 0 – 15 15 – 30 30 – 45 45 – 60 60 – 75
f 25 38 16 10 5
49. Obtain the regression line of X on Y for the following bi-variate frequency distribution.
Y
X
5 – 15 15 – 25 25 – 35 35 – 45
75 – 125 4 1 - -
125 – 175 7 6 2 1
175 – 225 1 3 4 2
225 – 275 1 1 3 4
Page | 4
Page 5
X\ Y 0 10 20
1 0 0.1 0.1
2 0.1 0.2 0.1
3 0.2 0.1 0.1
Section – E
V. Answer any two of the following questions. 2 × 5 = 10
51. Prepare a blank table to show the distribution of students according to
i. College: Government, Aided, Unaided.
ii. Faculty: Science, Commerce, Arts.
iii. Gender: Boys, Girls.
52. The following data relates to the expenditure of a family per month. Draw a pie chart.
Items Expense (in Rs.)
Food 3000
Clothing 1500
Rent 900
Education & medicine 500
Others 600
53. The mean and standard deviation of a distribution of 100 and 150 items are 50, 5 and 40, 6
respectively. Find the combained standard deviation of all the 250 items taken together.
54. A purse contains 4 silver and 2 gold coins. Another purse contains 3 silver and 4 gold coins. If a
coin is selected at random from one of the two purses, what is the probability that it is a silver
coin?
55. A box contains 8 items of which 2 are defective. A man selects 3 items. Find the expected
number of defective items in the selection.
*****
Page | 5
Document Details
| Board / Org | Karnataka Board |
| Exam | Class 11 |
| Type | Sample Paper |
| Pages | 5 |
| Updated | 22 Jul 2026 |