Karnataka 2nd PUC Model Question Paper 2022 for Statistics (English Medium)
Finished viewing? Save it for later —
Download Karnataka 2nd PUC Model Question Paper 2022 for Statistics (English Medium) (PDF · 5 pages)About Karnataka 2nd PUC Model Question Paper 2022 for Statistics (English Medium)
Karnataka 2nd PUC Model Question Paper 2022 for Statistics (English Medium) is available here for free download. Published by Karnataka Board for Class 12, this sample paper can be viewed online or downloaded as a PDF (5 pages). Candidates preparing for Class 12 can use Karnataka 2nd PUC Model Question Paper 2022 for Statistics (English Medium) to understand the exam pattern, the type of questions asked, and the overall difficulty level.
Frequently Asked Questions
How can I download Karnataka 2nd PUC Model Question Paper 2022 for Statistics (English Medium)?
Open this page and click the Download button to save Karnataka 2nd PUC Model Question Paper 2022 for Statistics (English Medium) as a PDF. It is completely free on AglaSem Docs.
Is Karnataka 2nd PUC Model Question Paper 2022 for Statistics (English Medium) free to download?
Yes. Karnataka 2nd PUC Model Question Paper 2022 for Statistics (English Medium) can be viewed online and downloaded as a PDF free of cost on AglaSem Docs.
How many pages does Karnataka 2nd PUC Model Question Paper 2022 for Statistics (English Medium) have?
Karnataka 2nd PUC Model Question Paper 2022 for Statistics (English Medium) contains 5 pages, which you can read online or download together as a single PDF.
Where can I find more Class 12 study material?
You can find more Class 12 question papers, sample papers, syllabus, and answer keys on AglaSem Docs.
Karnataka 2nd PUC Model Question Paper 2022 for Statistics (English Medium) – Text
Read the full text of this sample paper below — useful to quickly search, copy and reference the content online without downloading the PDF.
📄 View text version (5 pages)
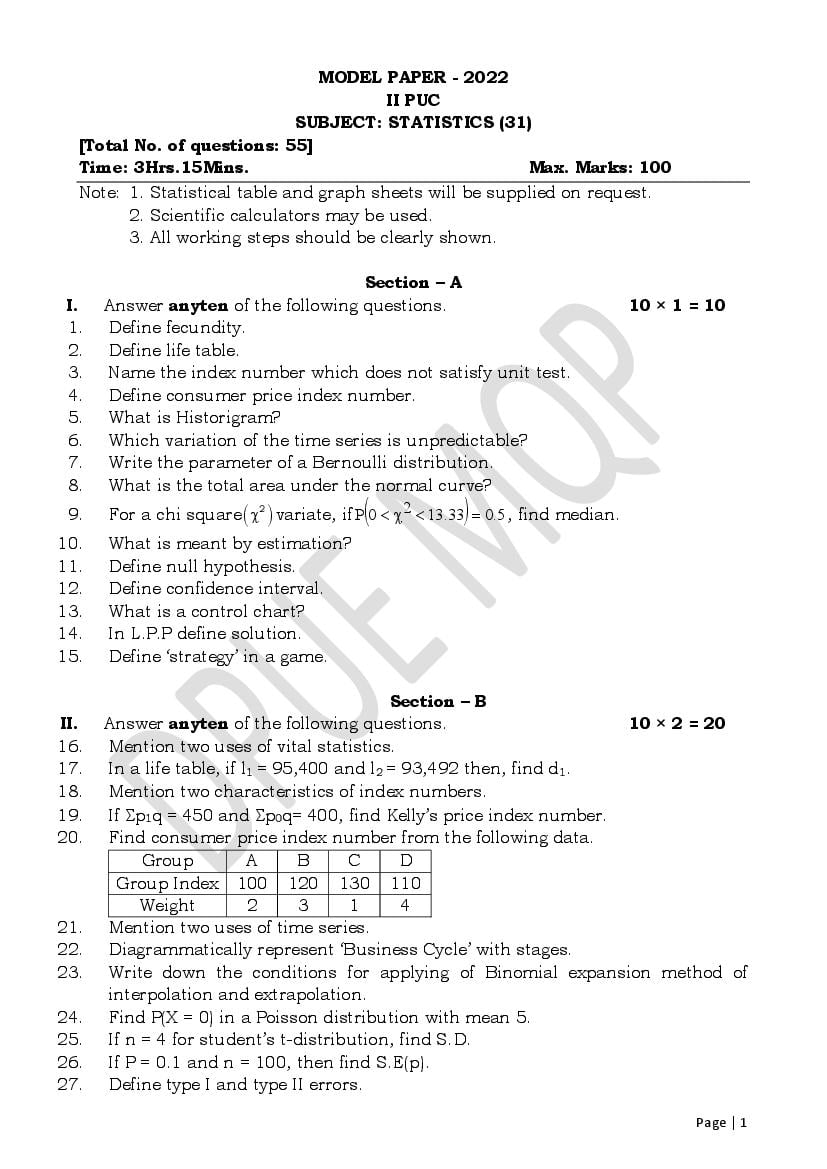
Page 1
II PUC
SUBJECT: STATISTICS (31)
[Total No. of questions: 55]
Time: 3Hrs.15Mins. Max. Marks: 100
Note: 1. Statistical table and graph sheets will be supplied on request.
2. Scientific calculators may be used.
3. All working steps should be clearly shown.
Section – A
I. Answer anyten of the following questions. 10 × 1 = 10
1. Define fecundity.
2. Define life table.
3. Name the index number which does not satisfy unit test.
4. Define consumer price index number.
5. What is Historigram?
6. Which variation of the time series is unpredictable?
7. Write the parameter of a Bernoulli distribution.
8. What is the total area under the normal curve?
9.
For a chi square 2 variate, if P 0 2 13.33 0.5 , find median.
10. What is meant by estimation?
11. Define null hypothesis.
12. Define confidence interval.
13. What is a control chart?
14. In L.P.P define solution.
15. Define ‘strategy’ in a game.
Section – B
II. Answer anyten of the following questions. 10 × 2 = 20
16. Mention two uses of vital statistics.
17. In a life table, if l1 = 95,400 and l2 = 93,492 then, find d1.
18. Mention two characteristics of index numbers.
19. If p1q = 450 and p0q= 400, find Kelly’s price index number.
20. Find consumer price index number from the following data.
Group A B C D
Group Index 100 120 130 110
Weight 2 3 1 4
21. Mention two uses of time series.
22. Diagrammatically represent ‘Business Cycle’ with stages.
23. Write down the conditions for applying of Binomial expansion method of
interpolation and extrapolation.
24. Find P(X = 0) in a Poisson distribution with mean 5.
25. If n = 4 for student’s t-distribution, find S.D.
26. If P = 0.1 and n = 100, then find S.E(p).
27. Define type I and type II errors.
Page | 1
Page 2
29. What are degenerate and non-degenerate solutions in T.P?
30. Mention two needs for replacement of equipments.
Section – C
III. Answer any eight of the following questions. 8 × 5 = 40
31. From the following data, find CBR and GFR.
Age [in Male Female Number of live
years] Population Population births
0 - 14 46000 43000 -
15 - 24 34000 32000 6846
25 - 39 39000 38000 3893
40 - 49 30000 28000 674
50 - 79 27000 26000 -
80 & above 15000 12000 -
32. For the following data, calculate gross reproduction rate.
Age group
15 - 19 20 - 24 25 - 29 30 - 34 35 - 39 40 - 44 45 - 49
[in years]
Female
14,000 15,000 14,000 13,000 12,000 11,000 10,000
population
Female
630 870 980 650 600 220 30
births
33. What are the steps involved in the construction of index number? Explain any
two of them.
34. The following are the prices (in Rs.) of items in 2010 and 2015. Find simple
geometric mean price index number.
Item A B C D E F
Price 2010 50 60 20 50 80 125
(Rs.) 2015 55 75 30 75 70 130
35. Obtain trend values by 3 yearly moving averages for the following data.
Year 1995 1996 1997 1998 1999 2000 2001 2002 2003 2004
Sales
86 63 45 58 43 57 98 120 100 150
(‘000)
36. For the following time series fit a linear trend by the method of least squares.
Year 2002 2004 2006 2008 2010 2012
Profit (in crores) 10 20 32 36 52 60
37. Interpolate and extrapolate the production for the years 2000 and 2010 with
the help of the following table.
Year 1980 1985 1990 1995 2000 2005 2010
Production (tons) 5 12 19 26 - 40 -
Page | 2
Page 3
find the probability that i) 3 are vegetarians, ii) at least one is vegetarian.
39. A pond has 10 fishes among which 4 are marked ones (marked fishes are
under scientific observation). 4 fishes are caught from the pond. Find the
probability that two of them are marked ones. Also find the mean of marked
ones.
40. It is required to test whether those who practice Yoga have average blood
sugar less than 120 mg/dl. A sample consisting of 36 persons who practice
Yoga is observed. If their mean blood sugar is 118.5 mg/dl and variance is 9
mg2/dl. At 1% level of significance what would you conclude?
41. For the following data examine whether the means differ significantly? Use
α=0.05.
Sample I II
Size 12 7
Mean 57.2 52.3
S.D. 3.41 3.62
42. From the following data, test whether ‘education’ and ‘employment’ are
independent at 1% level of significance.
Employment
Education
Employed Unemployed
Educated 20 25
Uneducated 15 40
43. In a floor mat manufacturing company, the average number of defects per
square meter is known to be 4. Determine the control limits for the number of
defects.
44. Solve the following L.P.P graphically:
Max. Z = 10x + 15y
s.t. x + y ≤ 10
3x + 2y ≥ 15
and x, y ≥ 0
OR
(For visually challenged students only)
Explain graphical method of solving L.P.P.
45. Solve the following game using the principle of dominance.
Page | 3
Page 4
B1 B2 B3 B4
A1 1 2 0 3
Player A A2 4 6 3 5
A3 3 1 2 0
Section – D
IV. Answer any two of the following questions. 2 × 10 = 20
46. From the following data, compute standardized death rates for Town A and
Town B. Comment on the results.
Age group Town - A Town - B Standard
[in years] Population Deaths Population Deaths Population
0 – 20 4,000 36 3,000 30 2,000
20 – 40 12,000 48 20,000 100 3,000
40 – 60 6,000 60 4,000 48 6,000
60 & above 8,000 152 3,000 60 4,000
47. Find Laspeyre’s, Paasche’s and Dorbish-Bowley’s price index numbers for the
following data.
2004 2008
Item
Price (Rs.) Quantity Price (Rs.) Quantity
A 10 5 15 4
B 15 8 20 7
C 6 3 10 5
D 3 4 4 5
48. For the following data verify whether Fisher’s index number satisfies TRT and
FRT.
Price (Rs.) Quantity
Item
Base year Current year Base year Current year
A 4 6 4 6
B 6 10 4 8
C 8 11 5 3
49. For the following time series fit a second degree trend of the type Y = a + bx + cx2
by the method of least squares. Estimate the profit for the year 2010.
Year 2005 2006 2007 2008 2009
Profit (in lakhs) 10 8 12 18 26
50. Following is the data regarding number of mistakes per page found in a book.
Fit a Poisson distribution. Test at 5% L.O.S. that it is a good fit.
No. of mistakes per page 0 1 2 3 4 5 and more
No. of pages 31 34 21 12 2 0
Section – E
V. Answer any two of the following questions. 2 × 5 = 10
Page | 4
Page 5
mean 80 and S.D. 5. Find the probability that a student selected at random
from the class scored i) more than 70 marks ii) between 75 and 90 marks.
52. In a random sample of 120 people from a city in the year 2011 revealed that
96 were cricket match viewers. In another random sample of 100 people from
same city in the year 2013 revealed that 90 were cricket match viewers.
Examine whether there is a significant increase in the proportion of cricket
match viewers. Use 1% level of significance.
53. The following data represents the blood pressure of 5 persons before and after
performing dhyana:
Person A B C D E
B.P. Before Dhyana 90 90 100 88 99
B.P. After Dhyana 88 90 95 90 96
Can we conclude at 5% level of significance that Dhyana reduces blood
pressure?
54. The purchase price of a machine is Rs 8,000. Its maintenance costs and
resale values are given below:
Year 1 2 3 4 5
Maintenance cost (Rs.) 500 600 800 1,100 1,500
Resale value (Rs.) 4,500 3,500 2,500 1,500 500
What would be the optimum replacement period of machine? What would be
the average annual cost?
55. There is a demand for 10,000 items per year. The replenishment cost is
Rs.200 and the maintenance cost is Rs.9 per item per year. Replenishment is
instantaneous and shortages are not allowed. Find economic order quantity
and minimum average inventory cost.
*****
Page | 5
Document Details
| Board / Org | Karnataka Board |
| Exam | Class 12 |
| Type | Sample Paper |
| Pages | 5 |
| Language | english |
| Updated | 30 Apr 2026 |