Class 10 Maths Extra Questions Chapter 13 Statistics
Finished viewing? Save it for later —
Download Class 10 Maths Extra Questions Chapter 13 Statistics (PDF · 14 pages)About Class 10 Maths Extra Questions Chapter 13 Statistics
Class 10 Maths Extra Questions Chapter 13 Statistics is available here for free download. Published by AglaSem for Class 10, this question bank can be viewed online or downloaded as a PDF (14 pages). Candidates preparing for Class 10 can use Class 10 Maths Extra Questions Chapter 13 Statistics to understand the exam pattern, the type of questions asked, and the overall difficulty level.
Frequently Asked Questions
How can I download Class 10 Maths Extra Questions Chapter 13 Statistics?
Open this page and click the Download button to save Class 10 Maths Extra Questions Chapter 13 Statistics as a PDF. It is completely free on AglaSem Docs.
Is Class 10 Maths Extra Questions Chapter 13 Statistics free to download?
Yes. Class 10 Maths Extra Questions Chapter 13 Statistics can be viewed online and downloaded as a PDF free of cost on AglaSem Docs.
How many pages does Class 10 Maths Extra Questions Chapter 13 Statistics have?
Class 10 Maths Extra Questions Chapter 13 Statistics contains 14 pages, which you can read online or download together as a single PDF.
Where can I find more Class 10 study material?
You can find more Class 10 question papers, sample papers, syllabus, and answer keys on AglaSem Docs.
Class 10 Maths Extra Questions Chapter 13 Statistics – Text
Read the full text of this question bank below — useful to quickly search, copy and reference the content online without downloading the PDF.
📄 View text version (14 pages)
Page 1
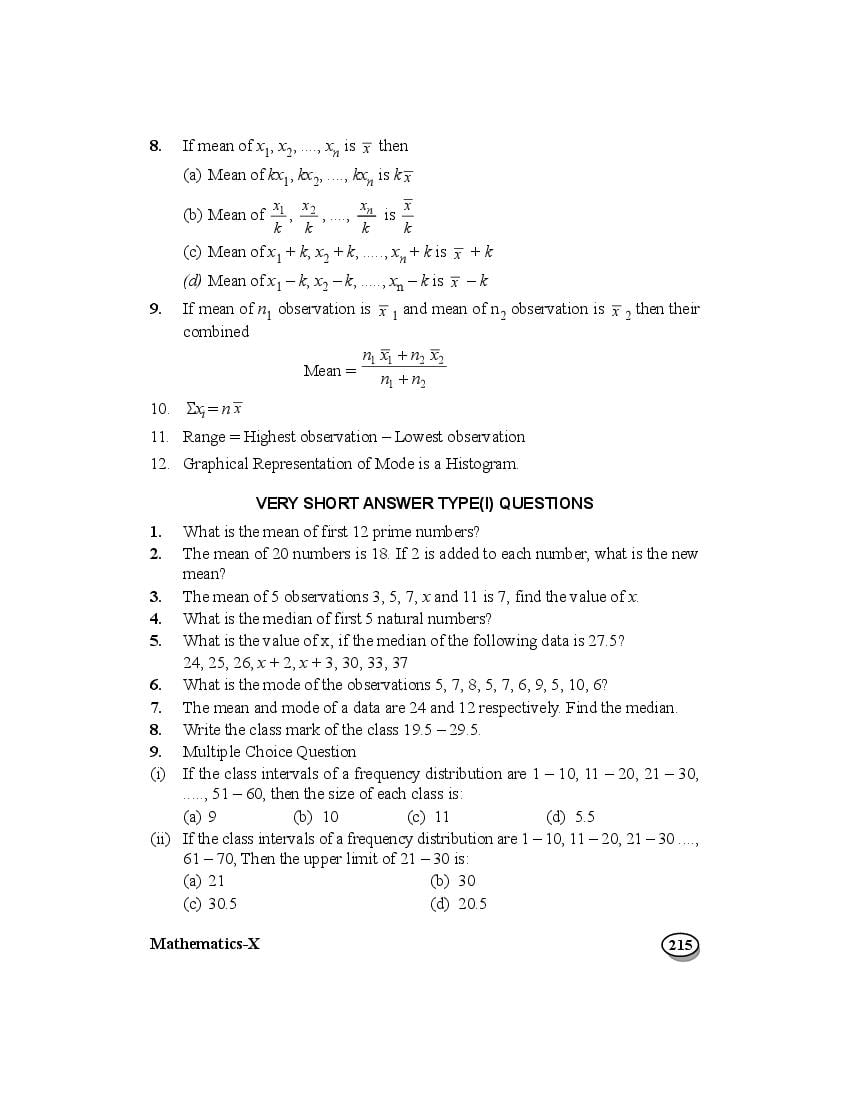
(a) Mean of kx1, kx2, ...., kxn is k x
x1 x2 x x
(b) Mean of , , ...., n is
k k k k
(c) Mean of x1 + k, x2 + k, ....., xn + k is x + k
(d) Mean of x1 – k, x2 – k, ....., xn – k is x – k
9. If mean of n1 observation is x 1 and mean of n2 observation is x 2 then their
combined
n1 x1 n2 x2
Mean = n1 n2
10. xi = n x
11. Range = Highest observation – Lowest observation
12. Graphical Representation of Mode is a Histogram.
VERY SHORT ANSWER TYPE(I) QUESTIONS
1. What is the mean of first 12 prime numbers?
2. The mean of 20 numbers is 18. If 2 is added to each number, what is the new
mean?
3. The mean of 5 observations 3, 5, 7, x and 11 is 7, find the value of x.
4. What is the median of first 5 natural numbers?
5. What is the value of x, if the median of the following data is 27.5?
24, 25, 26, x + 2, x + 3, 30, 33, 37
6. What is the mode of the observations 5, 7, 8, 5, 7, 6, 9, 5, 10, 6?
7. The mean and mode of a data are 24 and 12 respectively. Find the median.
8. Write the class mark of the class 19.5 – 29.5.
9. Multiple Choice Question
(i) If the class intervals of a frequency distribution are 1 – 10, 11 – 20, 21 – 30,
....., 51 – 60, then the size of each class is:
(a) 9 (b) 10 (c) 11 (d) 5.5
(ii) If the class intervals of a frequency distribution are 1 – 10, 11 – 20, 21 – 30 ....,
61 – 70, Then the upper limit of 21 – 30 is:
(a) 21 (b) 30
(c) 30.5 (d) 20.5
Mathematics-X 215
Page 2
Class 0–5 6 – 11 12 – 17 18 – 23 24 – 29
Frequency 13 10 15 8 11
The upper limit of median class is :
(a) 17 (b) 17.5 (c) 18 (d) 18.5
(iv) Daily wages of a factory workers are recorded as:
Daily wages (in `) 121 – 126 127 – 132 133– 138 139 – 144 145 – 150
No. of workers 5 27 20 18 12
The lower limit of Modal class is:
(a) ` 127 (b) ` 126 (c) ` 126.50 (d) ` 133
(v) For the following distribution
Class 0–5 5 – 10 10 – 15 15 – 20 20 – 25
Frequency 10 15 12 20 9
The sum of Lower limits of the median class and modal class is (CBSE 2020)
(a) 15 (b) 25 (c) 30 (d) 35
(vi) The median and mode respectively of a frequency distribution are 26 and 29.
Then, its mean is (CBSE 2020)
(a) 27.5 (b) 24.5 (c) 28.4 (d) 25.8
10. Find the class-marks of the classes 10-25 and 35-55. (CBSE 2020)
11. Fill in the blank
(a) Mode = 3_________ – 2 _________
(b) An ogive curve is used to determine _________ .
(c) If the point of intersection of ‘more than’ and ‘less than’ ogive is (20. 5, 30.7),
then the value of median is _________ .
(d) The mode of a frequency distribution is determined graphically by _________
.
(e) If the mode is 8 and mean is also 8, then median will be _________ .
(f) The measure of central tendency which cannot be determined graphically is
_________ .
(g) If the class marks of a continuous frequency distribution are 22, 30, 38, 46, 54,
62 then the class corresponding to class mark 46 is _________ .
216 Mathematics-X
Page 3
_________ .
(i) The step deviation formula for finding mean is _________ .
(j) The formula to find median of grouped data is _________ .
(k) The formula to find mode of grouped data is _________ .
(l) The Range of the observations 255, 125, 130, 160, 185, 170, 103 is _______ .
1
(m) Class mark = (________ + ________) .
2
(n) The median of Ist ten prime numbers is ________ .
(o) The assumed mean method to find mean is ________ .
SHORT ANSWER TYPE QUESTIONS (I)
12. The mean of 11 observation is 50. If the mean of first Six observations is 49 and
that of last six observation is 52, then find sixth observation.
13. Find the mean of following distribution:
x 12 16 20 24 28 32
f 5 7 8 5 3 2
14. Find the median of the following distribution:
x 10 12 14 16 18 20
f 3 5 6 4 4 3
15. Find the mode of the following frequency distribution:
Class 0–5 5–10 10 –15 15–20 20–25 25–30
Frequency 2 7 18 10 8 5
16. Draw a ‘less than’ ogive of the following data:
Marks No. of students
Less than 20 0
Less than 30 4
Less than 40 16
Less than 50 30
Less than 60 46
Less than 70 66
Less than 80 82
Less than 90 92
Less than 100 100
Mathematics-X 217
Page 4
Marks 0–10 10–20 20–30 30–40 40–50
No. of students 7 9 6 8 10
18. Find mode of the following frequency distribution :
Class Interval 25 – 30 30 – 35 35 – 40 40 – 45 45 – 50 50 – 55
Frequency 25 34 50 42 38 14
(CBSE 2018 - 19)
19. What is the median of the following data? (CBSE 2011)
x 10 20 30 40 50
f 2 3 2 3 1
20. Mean of a frequency distribution ( x ) is 45. If f i = 20 find f i x i
(CBSE 2011)
21. Find the mean of the following distribution : (CBSE 2020)
Class 3–5 5–7 7–9 9 – 11 11 – 13
Frequency 5 10 10 7 8
22. Find the mode of the following data : (CBSE 2020)
Class 0 – 20 20 – 40 40 – 60 60 – 80 80 – 100 100 – 120 120-140
Frequency 6 8 10 12 6 5 3
23. Compute the mode for the following frequency distribution: (CBSE 2020)
Size of items 0 – 4 4–8 8 – 12 12 – 16 16 – 20 20 – 24 24 – 28
(in cm)
Frequency 5 7 9 17 12 10 6
SHORT ANSWER TYPE QUESTIONS (II)
24. If the mean of the following distribution is 54, find the value of P.
Class 0–20 20–40 40–60 60–80 80–100
Frequency 7 P 10 9 13
25. Find the median of the following frequency distribution :
C.I. 0–10 10–20 20–30 30–40 40–50 50–60
f 5 3 10 6 4 2
218 Mathematics-X
Page 5
frequency x.
Age (In years) 0–10 10–20 20–30 30–40 40–50
No. of persons 5 25 x 18 7
27. Find the median of the following data:
Marks Below 10 Below 20 Below 30 Below 40 below 50 Below 60
No. of student 0 12 20 28 33 40
28. Draw a ‘more than type’ ogive of the following data :
Weight (In kg.) 30–35 35–40 40–45 45–50 50–55 55–60
No. of Students 2 4 10 15 6 3
29. Find the mode of the following data:
Height (In cm) Above 30 Above 40 Above 50 Above 60 Above 70 Above 80
No. of plants 34 30 27 19 8 2
30. The following table represent marks obtained by 100 students in a test:
Marks obtained 30 – 35 35 – 40 40 – 45 45 – 50 50 – 55 55 – 60 60 – 65
No. of students 14 16 28 23 18 8 3
Find mean marks of the students. (CBSE 2018 -19)
31. The following table represent pocket allowance of children of a colony. The
mean pocket allowance is ` 18. Find the missing frequency.
Daily pocket 11 – 13 13 – 15 15 – 17 17 – 19 19 – 21 21 – 23 23 – 25
allowance (in `)
No. of children 3 6 9 13 k 5 4
(CBSE – 2018)
32. Find mode of the following frequency distribution:
Class Interval 0–20 20–40 40–60 60–80 80–100
No. of Students 15 18 21 29 17
The mean of above distribution is 53. Use Empirical formula to find approximate
value of median.
Mathematics-X 219
Page 6
33. The mean of the following data is 53, Find the values of f1 and f2.
C.I 0–20 20–40 40–60 60–80 80–100 Total
f 15 f1 21 f2 17 100
34. If the median of the distribution given below is 28.5, find the values of x and y.
C.I 0–10 10–20 20–30 30–40 40–50 50–60 Total
f 5 8 x 15 y 5 60
35. The median of the following distribution is 35, find the values of a and b.
C.I 0–10 10–20 20–30 30–40 40–50 50–60 60–70 Total
f 10 20 a 40 b 25 15 170
36. Find the mean, median and mode of the following data:
C.I 11–15 16–20 21–25 26–30 31–35 36–40 41–45 46–50
f 2 3 6 7 14 12 4 2
37. The rainfall recorded in a city for 60 days is given in the following table:
Raifall (In cm) 0–10 10–20 20–30 30–40 40–50 50–60
No. of Days 16 10 8 15 5 6
Calulate the median rainfall using a more than type ogive.
38. Find the mean of the following distribution by step- deviation method:
Daily Expenditure 100–150 150–200 200–250 250–300 300–350
(in `)
No. of Households 4 5 12 2 2
39. The distribution given below show the marks of 100 students of a class:
Marks 0–5 5–10 10–15 15–20 20–25 25–30 30–35 35–40
No. of 4 6 10 10 25 22 18 5
Students
Draw a ‘less than’ type and a ‘more than’ type ogive from the given data. Hence
obtain the median marks from the graph.
220 Mathematics-X
Page 7
Profit (` in lakh) No. of Factories
More than or equal to 5 30
More than or equal to 10 28
More than or equal to 15 16
More than or equal to 20 14
More than or equal to 25 10
More than or equal to 30 7
More than or equal to 35 3
More than or equal to 40 0
Draw both ogives for the data and hence find the median.
41. Convert the following distribution into ‘Less than’ and then draw its ogive
(CBSE 2018 -19)
Class Interval 30 – 40 40 – 50 50 – 60 60 – 70 70 – 80 80 – 90 90 – 100
Frequency 7 5 8 10 6 6 8
42. If mean of the given distribution is 65.6 find the missing frequency.
(CBSE 2017)
Class Interval 10 – 30 30 – 50 50 – 70 70 – 90 90 – 110 110 – 130 Total
Frequency 5 8 f1 20 f2 2 50
43. The mode of the frequency distribution is 36. Find the missing frequency (f).
(CBSE 2020)
Class 0 – 10 10 – 20 20 – 30 30 – 40 40 – 50 50 – 60 60 – 70
Frequency 8 10 f 16 12 6 7
44. The mean of the following frequency distribution is 18. The frequency f in the
class interval 19-21 is missing. Determine f. (CBSE 2020)
Class Interval 11– 13 13 – 15 15 – 17 17 – 19 19 – 21 21 – 23 23 – 25
Frequency 3 6 9 13 f 5 4
45. The following table gives production yield per hectare of wheat of 100 farms
of a village : (CBSE 2020)
Production Yield 40 – 45 45 – 50 50 – 55 55 – 60 60 – 55 65 – 70
Frequency 4 6 16 20 30 24
Change the distribution to a ‘more than’ type distribution and draw its ogive.
Mathematics-X 221
Page 8
1. 16.4 approx. 2. 20
3. 9 4. 3
5. x = 25 6. 5
7. Median = 20 8. 24.5
9. (i) B (First make intervals continuous, Then find class size)
(ii) C
(iii) B
(iv) C
Modal class 15 – 20
(v) B
Median class 10 –15
(vi) B
10. 17.5 and 45
11. (a) 3 Median – 2 mean (b) Median
(c) 20.5 (d) Histogram
(e) 8 (f) Mean
(g) 42 – 50 (as difference b/w 2 consecutive observation is 8
8 8
Subtract form 46 for Lower Limit and Add to 46 for upper Limit)
2 2
f i ui
(h) Median (i) x = a + f h
i
n
2 – cf ( f1 fo )
(j) Median = l + h (k) Mode = l + h
f (2 f1 fo f 2 )
1
(l) Range = 255 – 103 = 152 (m) (upper limit + Lower limit)
2
fi d i
(n) 12.9 (o) x = a + f
i
222 Mathematics-X
Page 9
14. 14 15. 12.89 approx.
17. Marks No. of students
less than 10 7
less than 20 16
less than 30 22
less than 40 30
less than 50 40
18. Class Interval Frequency
25 – 30 25
30 – 35 34 = f0
35 – 40 50 = f1
40 – 45 42 = f2
45 – 50 38
50 – 55 14
f1 – f 0 h = 35 +
50 – 34 5 = 35 + 16 5
Mode = l +
2 f1 – f0 – f 2 100 – 34 – 42 24
= 35 + 3.33 = 38.33 approx.
19. xi fi cf
10 2 2
20 3 5
30 2 7
40 3 10
50 1 11
Total 11
N = 11 (odd)
th
N 1
Median = observation = 6th observation = 30
2
Mathematics-X 223
Page 10
20. x = f 45 20 fi xi 900
i
21. 8.15 22. 62.5
23. 14.46 cm 24. 11
25. 27 26. 25
27. 30 29. 63.75 cm
30. Mark xi di ui fi fiui
30 – 35 32.5 – 15 –3 14 – 42
35 – 40 37.5 – 10 –2 16 – 32
40 – 45 42.5 –5 –1 28 – 28
45 – 50 47.5 = a 0 0 23 0
50 – 55 52.5 5 1 18 18
55 – 60 57.5 10 2 8 16
60 – 65 62.5 15 3 3 9
110 –59
fi ui 59
x =a+ h = 47.5 – 5 = 47.5 – 2.68 = 44.82
f i 110
31. (Make Table just like Q. 30)
fi ui
x =a+ h
f i
k – 8 2
18 = 18 +
40 k
2k – 16 = 0
k=8
f1 – f0
32. Mode = l + 2 f – f – f h
1 0 2
29 – 21
= 60 + 2 29 – 21 – 17 20 = 68
224 Mathematics-X
Page 11
68 = 3 Median – 2 × 53
68 106
= Median
3
Median = 58
33. f1 = 18, f2 = 29 34. x = 20, y = 7
35. a = 35, b = 25
36. Mean = 32, median = 33, mode = 34.39 approx.
37. Median = 25 cm 38. Mean = ` 211
39. Median = 24 40. Median = ` 17.5 lakhs.
41. Less than f cf
Less than 40 7 7
Less than 50 5 12
Less than 60 8 20
Less than 70 10 30
Less than 80 6 36
Less than 90 6 42
Less than 100 8 50
Plot (40,7), (50, 12), (60, 20), (70, 30) (80, 36), (90, 42), (100, 50)
Join free hand to get ogive.
42. C.I fi xi fixi
10 – 30 5 20 100
30 – 50 8 40 320
50 – 70 f1 60 60f1
70 – 90 20 80 1600
90 – 110 f2 100 100f2
110 – 130 2 120 240
35 + f1 + f2 2260 + 60 f1 + 100 f2
Mathematics-X 225
Page 12
fixi
x = fi
2260 60 f1 100 f 2
65.6 =
50
3 f1 + 5f2 = 51 ...(2)
Solve (1) & (2) f1 = 12, f2 = 3
43. f = 10
44. f = 8
226 Mathematics-X
Page 13
Statistics
Time : 1 Hr. M.M. : 20
SECTION-A
1. Find the class mark of a class a – b 1
2. Find the mean of all the even numbers between 11 and 21. 1
3. An ogive curve is used to detemine 1
(a) Range (b) Mean (c) Mode (d) Median
4. State True/False : 1
“Mean can be determined graphically.”
SECTION-B
5. The mean of 50 observations is 20. If each observation is multiplied by 3, then
find the new mean. 2
6. The mean of 10 observations is 15.3. If two observations 6 and 9 are replaced
by 8 and 14 respectively. Find the new mean. 2
7. Write the modal class for the following frequency distribution 2
Classes 1–4 5–8 9 – 12 13 – 16 17 – 20 21 – 24
frequency 8 9 1 12 8 9
SECTION-C
8. Find the mean: 3
Marks less than 20 less than 40 less than 60 less than 80 less than 100
No. of Students 4 10 28 36 50
9. Find the value of x if the mode is given to be 58 years. 3
Age (in years) 20–30 30–40 40–50 50–60 60–70 70–80
No. of patients 5 13 x 20 18 19
SECTION-D
10. The mean of the following frequency distribution is 57.6 and the number of
observations is 50. Find the value of f1 & f2. 4
Mathematics-X 227
Page 14
frequency 7 f1 12 f2 8 5
OR
Following is the age distribution of cardiac patients admitted during a month
in a hospital:
Age (in years) 20–30 30–40 40–50 50–60 60–70 70–80
No. of patients 2 8 15 12 10 5
Draw a ‘less than type’ and ‘more than type’ ogives and from the curves, find
the median.
228 Mathematics-X
Document Details
| Board / Org | Aglasem |
| Exam | Class 10 |
| Type | Question Bank |
| Pages | 14 |
| Updated | 22 Jul 2026 |