WBCHSE Class 12 Syllabus for Statistics
Finished viewing? Save it for later —
Download WBCHSE Class 12 Syllabus for Statistics (PDF · 5 pages)About WBCHSE Class 12 Syllabus for Statistics
WBCHSE Class 12 Syllabus for Statistics is available here for free download. Published by West Bengal Board for Class 12, this syllabus can be viewed online or downloaded as a PDF (5 pages). Candidates preparing for Class 12 can use WBCHSE Class 12 Syllabus for Statistics to understand the exam pattern, the type of questions asked, and the overall difficulty level.
Frequently Asked Questions
How can I download WBCHSE Class 12 Syllabus for Statistics?
Open this page and click the Download button to save WBCHSE Class 12 Syllabus for Statistics as a PDF. It is completely free on AglaSem Docs.
Is WBCHSE Class 12 Syllabus for Statistics free to download?
Yes. WBCHSE Class 12 Syllabus for Statistics can be viewed online and downloaded as a PDF free of cost on AglaSem Docs.
How many pages does WBCHSE Class 12 Syllabus for Statistics have?
WBCHSE Class 12 Syllabus for Statistics contains 5 pages, which you can read online or download together as a single PDF.
Where can I find more Class 12 study material?
You can find more Class 12 question papers, sample papers, syllabus, and answer keys on AglaSem Docs.
WBCHSE Class 12 Syllabus for Statistics – Text
Read the full text of this syllabus below — useful to quickly search, copy and reference the content online without downloading the PDF.
📄 View text version (5 pages)
Page 1
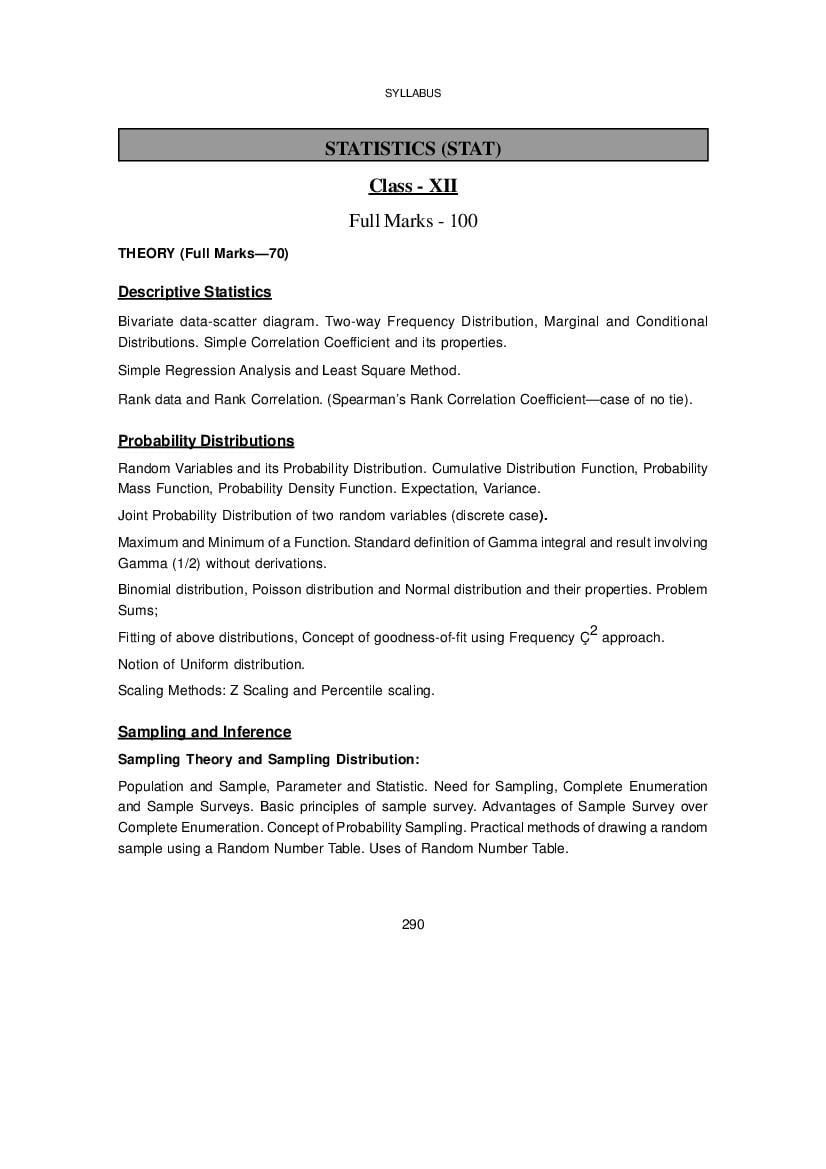
Class - XII
Full Marks - 100
THEORY (Full Marks—70)
Descriptive Statistics
Bivariate data-scatter diagram. Two-way Frequency Distribution, Marginal and Conditional
Distributions. Simple Correlation Coefficient and its properties.
Simple Regression Analysis and Least Square Method.
Rank data and Rank Correlation. (Spearman’s Rank Correlation Coefficient—case of no tie).
Probability Distributions
Random Variables and its Probability Distribution. Cumulative Distribution Function, Probability
Mass Function, Probability Density Function. Expectation, Variance.
Joint Probability Distribution of two random variables (discrete case).
Maximum and Minimum of a Function. Standard definition of Gamma integral and result involving
Gamma (1/2) without derivations.
Binomial distribution, Poisson distribution and Normal distribution and their properties. Problem
Sums;
Fitting of above distributions, Concept of goodness-of-fit using Frequency Ç2 approach.
Notion of Uniform distribution.
Scaling Methods: Z Scaling and Percentile scaling.
Sampling and Inference
Sampling Theory and Sampling Distribution:
Population and Sample, Parameter and Statistic. Need for Sampling, Complete Enumeration
and Sample Surveys. Basic principles of sample survey. Advantages of Sample Survey over
Complete Enumeration. Concept of Probability Sampling. Practical methods of drawing a random
sample using a Random Number Table. Uses of Random Number Table.
290
Page 2
Concept of Sampling distribution of sample mean and its standard error.
Basic Concepts of Inference:
Estimation:
Idea of Inference: Point Estimation, Interval Estimation and Testing of Hypothesis. Estimator
and Estimate. Criterion of a good Estimator. Concept of bias. Idea of Unbiasedness and Minimum
Variance Unbiasedness.Point Estimation of Binomial proportion, Poisson mean, Normal mean
and variance (using method of moments.)
Testing of Hypothesis:
Statistical tests of Hypothesis – Null and Alternative Hypothesis. Simple and Composite Hypothesis.
Types I and Type II Error. Critical Region. Level of Significance. Power. One Sided and Two
Sided test, Critical Value.
Tests of Significance related to a single Binomial proportion and Poisson mean (using large
sample approximations), Mean and variance of a single univariate Normal distribution.
Application of Statistics II [10M]
Time Series Analysis:
Introduction. Different Components of a Time Series. Determination of Trend by method of simple
moving-averages and by fitting Mathematical curves (straight line and exponential curve) using
Least Square principle.
Statistical Quality Control:
Introduction. Idea of Quality and Quality Control. Advantages of Statistical Quality Control. Process
Control and Lot Control. Control Chart Technique. Construction of Control Charts by variables
(X, R) and Attributes (p, np).
291
Page 3
PRACTICAL Full Marks—30
(Problems: 18, Laboratory Note Book: 4, Project work: 5, Viva-Voce: 3)
List of Problem Sets
1. Scatter Diagram, Correlation Coefficient and Regression (ungrouped data only).
2. Spearman’s Rank Correlation coefficient (case of no tie).
3. Applications and Fitting of Binomial Distribution, Poisson Distribution and only
applications of Normal Distribution. (Fitting of Normal Distribution is excluded)
4. Drawing of Random samples (SRSWR and SRSWOR) –using Random Number
Tables.
5. Sampling distribution of Sample Mean from a finite population based on simple
random sampling with/without replacement. [Start with a population having finite
number of values; choose a sample size (2,3 etc.), list all possible samples of the
chosen size, calculate sample mean based on each such sample, obtain the frequency
distribution of the sample mean and display diagrammatically.
6. Estimation of Population Mean and estimation of Standard Error (under SRSWR
and SRSWOR).
7. Testing of Hypothesis in case of Binomial proportion, Poisson parameter, mean &
variance of Normal distribution.
8. Determination of Trend (Moving Average Method, Straight Line and Exponential
Curve by Least Square Method.)
9. Construction of Control Chart: p, np, X, R.
10. PROJECT WORK
It will be based on Collection and Analysis of Data. The analysis should be from any
one of the following topics;
(a) Correlation and Regression including Rank Correlation.
(b) Trend Determination
(c) Estimation of Population Mean and Standard Error in case of SRSWR,
SRSWOR.
292
Page 4
1. For Laboratory Note Book, square sheets and white sheets both are to be used by the
students. But if the square sheets are not available then the students may use Laboratory
Note book as used in practical in Biological Sciences, Physics, and Chemistry etc.
2. Strictly, HB pencil is to be used in Laboratory sessions. Scientific calculators may be used.
Statistical tables if required are to be supplied by the institutions. Geometry Box may also
be used.
3. A problem set on a specific topic covering different numerical problems based on secondary
data is to be supplied to the students in a laboratory session. This may be typed or printed
or neatly hand-written in white papers.
Each problem set should carry at the top
(a) The Problem Set Number.
(b) Heading (in capital letters).
(c) Working Date.
4. While solving any problem in any of the problem sets, students must mention the relevant
formula with description of notations and theory, in brief if required, in the white papers or
in the white side of the inter-leaf sheet. No derivation or discussion is needed.
5. The necessary calculations are to be shown step wise with specification of units, wherever
required. Workings should be presented in a neat form through tables etc. whenever
required, in the square sheet or in the ruled side of the inter-leaf sheet.
6. For graphs and diagrams the c.m. / m.m. graph paper of appropriate size that suits the
practical note book are to be used. Both the axes should be labeled, scales to be mentioned
and name of the chart (diagram) is to be mentioned clearly. The graph sheets are to be
presented adjacent to the relevant workings of the problem concerned.
7. All the Problem sets enlisted in the syllabus must be completed, examined and signed
with date by the teacher concerned. Finally it should be arranged serially, according to the
content index.
8. There should be a content Index at the very beginning of the Laboratory Note Book consisting of
(a) Serial Number
(b) Heading of Problem Set
(c) Working Date and
(d) Page Number.
293
Page 5
1. The Practical Examination is to be held on a single day simultaneously in all the
institutions.
2. If it is not possible to hold the examination on a same day then there should be at least
three sets of questions since it is a problem based Practical.
3. The Practical Examination will be of two hours duration including Viva-Voce.
4. Questions of Viva-Voce may be asked by the External Examiner to test the depth of
understanding in both theory and practical, preferably on Project Work.
5. Only scientific calculators are allowed.
6. Statistical table will not be given in the question paper. If required, it will be supplied by the
institution.
7. The completed Laboratory Note Book covering all the topics as prescribed in the syllabus
must be submitted during the examination.
294
Document Details
| Board / Org | West Bengal Board |
| Exam | Class 12 |
| Type | Syllabus |
| Pages | 5 |
| Updated | 22 Jul 2026 |