Karnataka 2nd PUC Model Question Paper 2027 for Statistics (Paper 4)
Finished viewing? Save it for later —
Download Karnataka 2nd PUC Model Question Paper 2027 for Statistics (Paper 4) (PDF · 4 pages)About Karnataka 2nd PUC Model Question Paper 2027 for Statistics (Paper 4)
Karnataka 2nd PUC Model Question Paper 2027 for Statistics (Paper 4) is available here for free download. Published by Karnataka Board for Class 12, this sample paper can be viewed online or downloaded as a PDF (4 pages). Candidates preparing for Class 12 can use Karnataka 2nd PUC Model Question Paper 2027 for Statistics (Paper 4) to understand the exam pattern, the type of questions asked, and the overall difficulty level.
Frequently Asked Questions
How can I download Karnataka 2nd PUC Model Question Paper 2027 for Statistics (Paper 4)?
Open this page and click the Download button to save Karnataka 2nd PUC Model Question Paper 2027 for Statistics (Paper 4) as a PDF. It is completely free on AglaSem Docs.
Is Karnataka 2nd PUC Model Question Paper 2027 for Statistics (Paper 4) free to download?
Yes. Karnataka 2nd PUC Model Question Paper 2027 for Statistics (Paper 4) can be viewed online and downloaded as a PDF free of cost on AglaSem Docs.
How many pages does Karnataka 2nd PUC Model Question Paper 2027 for Statistics (Paper 4) have?
Karnataka 2nd PUC Model Question Paper 2027 for Statistics (Paper 4) contains 4 pages, which you can read online or download together as a single PDF.
Where can I find more Class 12 study material?
You can find more Class 12 question papers, sample papers, syllabus, and answer keys on AglaSem Docs.
Karnataka 2nd PUC Model Question Paper 2027 for Statistics (Paper 4) – Text
Read the full text of this sample paper below — useful to quickly search, copy and reference the content online without downloading the PDF.
📄 View text version (5 pages)
Page 1
Karnataka 2nd PUC
Model Question Paper
2027 for Statistics
(Paper 4)
EXAM YEAR TYPE SUBJECT
Karnataka Class 12 2027 Sample Paper Statistics
Notes · Sample Papers · Previous Year Papers · Mock Tests
Page 2
m .co
m .co s e m
se g l a
` a
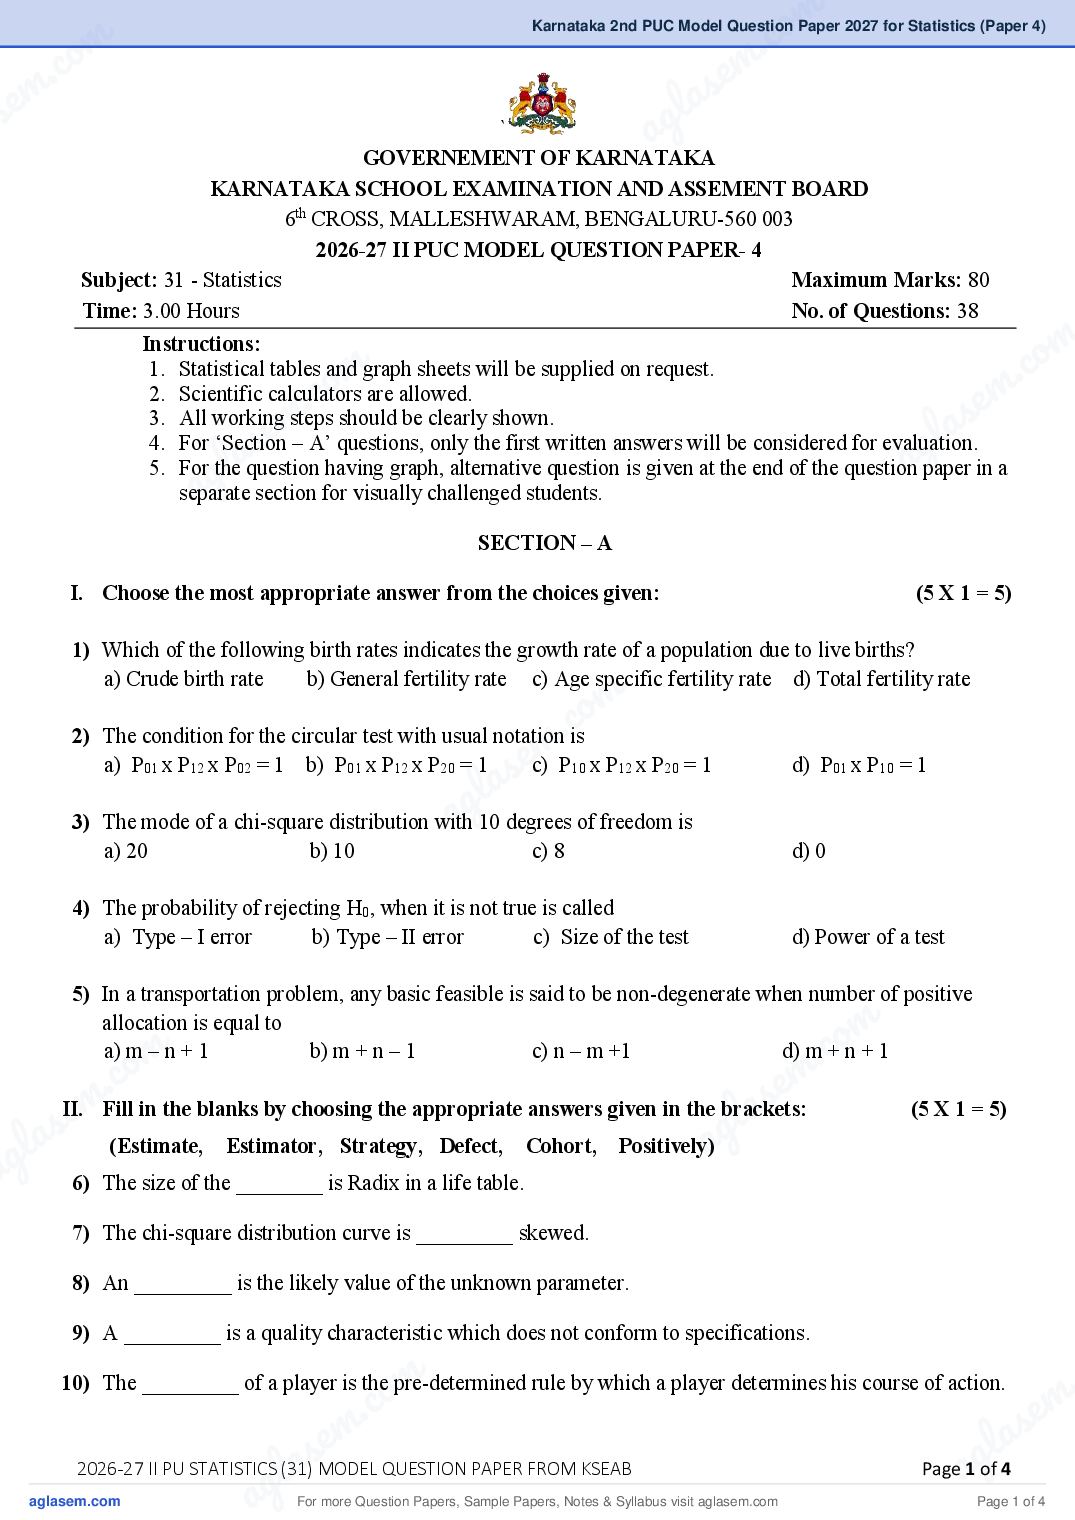
GOVERNEMENT OF KARNATAKA
KARNATAKA SCHOOL EXAMINATION AND ASSEMENT BOARD
6th CROSS, MALLESHWARAM, BENGALURU-560 003
2026-27 II PUC MODEL QUESTION PAPER- 4
Subject: 31 - Statistics Maximum Marks: 80
Time: 3.00 Hours No. of Questions: 38
m
.co
Instructions:
m
.co
1. Statistical tables and graph sheets will be supplied on request.
e m
s
2. Scientific calculators are allowed.
e m
3. All working steps should be clearly shown.
l a
as
4. For ‘Section – A’ questions, only the first written answers will be considered for evaluation.
l ag
ag
5. For the question having graph, alternative question is given at the end of the question paper in a
separate section for visually challenged students.
SECTION – A
I. Choose the most appropriate answer from the choices given: (5 X 1 = 5)
1) Which of the following birth rates indicates the growth rate of a population due to live births?
m
a) Crude birth rate b) General fertility rate c) Age specific fertility rate d) Total fertility rate
c
2) The condition for the circular test with usual notation.is
o
a) P x P x P = 1 b) P x P x P = 1 sec) P x P x P = 1
m
la
01 12 02 01 12 20 10 12 20 d) P01 x P10 = 1
3) The mode of a chi-square distribution with
g
a 10 degrees of freedom is
a) 20 b) 10 c) 8 d) 0
4) The probability of rejecting H0, when it is not true is called
a) Type – I error b) Type – II error c) Size of the test d) Power of a test
5) In a transportation problem, any basic feasible is said to be non-degenerate when number of positive
m
.co
allocation is equal to
m
a) m – n + 1 b) m + n – 1 c) n – m +1
.co
d) m + n + 1
e m
l as
emFill in the blanks by choosing the appropriate answers given in the brackets:
s
II. (5 X 1 = 5)
la (Estimate, Estimator, Strategy, Defect, Cohort, Positively)a g
g
a 6) The size of the ________ is Radix in a life table.
7) The chi-square distribution curve is _________ skewed.
8) An _________ is the likely value of the unknown parameter.
9) A _________ is a quality characteristic which does not conform to specifications.
m .
.co m
10) The _________ of a player is the pre-determined rule by which a player determines his course of action.
m s e
s e l a
1g
g la MODEL QUESTION PAPER FROM KSEAB
2026-27 II PU STATISTICS (31) Pagea of 4
a For more Question Papers, Sample Papers, Notes & Syllabus visit Page 1 of 4
Page 3
11) A B
a. Infant i. Range: 0,1
b. Cost of living index number ii. Producer’s risk
c. Bernoulli distribution iii. Child aged less than one year
d. Level of significance iv. Minimax
e. Maximum of row minimums v. Retail price of commodities
vi. Maximin
IV. Answer the following questions: (5 X 1 = 5)
12) What is the value of the index number of the base year?
13) Which component of the time series is associated with “the increase in online payment for a long period
of time”?
14) Write the relationship between mean and variance of a Bernoulli distribution.
15) Define ‘type – I error’ in testing of hypothesis.
16) When is the transportation problem said to be unbalanced?
SECTION – B
V. Answer any FIVE of the following questions: (5 X 2 = 10)
17) State the different phases of a business cycle.
18) Write two conditions for applying Newton’s advancing difference method of interpolation.
19) If a binomial distribution has mean 3 and variance 2, then find the value of ‘p’.
20) Calculate the variance of a student’s t-distribution with 4 degrees of freedom.
21) Given: P = 0.3 and n = 200, find S.E.(p).
22) Mention two types of estimation in statistical inference.
23) Name the control charts for attributes.
24) Pay-off matrix of player – A is given below. Write the pay-off matrix of player – B.
Player – B
B1 B2
A1 3 -2
Player – A A2 1 3
A3 -5 4
SECTION – C
VI. Answer any FOUR of the following questions: (4 X 5 = 20)
25) Calculate suitable price index number from the following data.
Item Base year Current year
price (in Rs) Price (in Rs) Quantity
A 13 16 20
B 15 21 30
C 21 25 40
D 25 31 50
2026-27 II PU STATISTICS (31) MODEL QUESTION PAPER FROM KSEAB Page 2 of 4
For more Question Papers, Sample Papers, Notes & Syllabus visit Page 2 of 4
Page 4
m .co
c.26)o Interpolate and extrapolate the production for the years 2025 and 2027sbyemusing binomial expansion
m method. la
se g
Year 2022 2023 2024 a 2025 2026 2027
Production (‘000 tons) 32 50 80 - 140 -
27) It is known that 2% of the items manufactured by a firm are defective. Items are supplied in packets of 50
each. What is the probability that a randomly selected packet contains at least one defective item?
28) In a hyper-geometric distribution, if the parameters are a =4, b = 8, and n = 6, then find:
m
.co
a) P (X = 2), b) standard deviation.
m
.co
29) Test whether mean daily wages of workers of factory – A and factory – B are equal from the following
m s e m
s e l a
ag
data. (Use 1% level of significance).
g l a
Factory No. of workers Mean daily wage (in Rs) Standard deviation (in Rs)
A a 50 405 10
B 200 410 20
30) The cost of an equipment is Rs 52,000 and its scrap value is Rs 2,000. The maintenance costs found from
the past experience are as follows:
Year 1 2 3 4 5 6
Maintenance cost (in Rs) 1000 2000 4000 7000 12000 20000
m
.co
Find the optimum replacement period.
e m
s
31) The demand for an item is 8000 units/year. The cost of placing an order is Rs 360. The holding cost is
la
Rs 16/unit/year. The shortage cost is Rs 3/unit/year. Find:
g
(i) Economic order quantity
(ii) Re-order time.
a
VII. Answer any TWO of the following questions: (2 X 5 = 10)
32) If X is a normal variate with mean µ and standard deviation σ, find the probability that X takes a value in
the 1σ neighbourhood of µ.
33) Test whether the attributes of ‘education’ and ‘employment’ are independent at 1% level of significance
m
m
for the following data.
.co
.co Employed Unemployed
s e m
s em Educated 20 30
g l a
la a
Uneducated 30 20
g
a 34) Find the control limits for R-chart from the following data, given n = 5.
Sample number 1 2 3 4 5 6
Range 14 8 11 9 6 12
35) Solve the following linear programming problem graphically:
Minimize Z = 50x + 60y
Subject to constraints: 5x + 4y ≤ 40
m .
.co m
3x + 4y ≥ 24
m
and x, y ≥ 0 s e
s e l a
3g
g la MODEL QUESTION PAPER FROM KSEAB
2026-27 II PU STATISTICS (31) Pagea of 4
a For more Question Papers, Sample Papers, Notes & Syllabus visit Page 3 of 4
Page 5
VIII. Answer any TWO of the following questions: (2 X 10 = 20)
36) a) Calculate gross reproduction rate from the following data. (05)
Age group Female Female
(in years) population births
15 – 19 15000 450
20 – 24 13000 780
25 – 29 12500 625
30 – 34 11000 440
35 – 39 10000 300
40 – 44 8500 85
45 – 49 7000 42
b) Calculate standardized death rates of the two towns from the following table.
Age group Deaths per thousand Standard
(in years) Town – A Town – B population
Below 21 20 25 10000
21 – 40 5 7 20000
40 – 60 10 11 15000
60 and above 40 45 5000
37) Calculate Dorbish – Bowley’s and Fisher’s price index numbers for the following data.
Item 2021 2025
Price (in Rs) Quantity Price (in Rs) Quantity
A 14 12 20 15
B 20 14 27 20
C 25 16 22 30
D 27 21 38 28
38) Fit a straight line trend equation of the form y = a + bx by using the method of least squares for the
following time series data. Obtain the trend values and estimate the value for the year 2026.
Year 2021 2022 2023 2024 2025
Value 20 32 24 36 28
SECTION - E
(For Visually challenged students only)
35) Write the procedure of solving linear programming problem graphically.
***
2026-27 II PU STATISTICS (31) MODEL QUESTION PAPER FROM KSEAB Page 4 of 4
For more Question Papers, Sample Papers, Notes & Syllabus visit Page 4 of 4
Document Details
| Board / Org | Karnataka Board |
| Exam | Class 12 |
| Type | Sample Paper |
| Pages | 4 |
| Language | english |
| Updated | 03 Nov 2026 |