Goa Board Class 12 Syllabus 2027 Economics
Finished viewing? Save it for later —
Download Goa Board Class 12 Syllabus 2027 Economics (PDF · 13 pages)About Goa Board Class 12 Syllabus 2027 Economics
Goa Board Class 12 Syllabus 2027 Economics is available here for free download. Published by Goa Board for Class 12, this syllabus can be viewed online or downloaded as a PDF (13 pages). Candidates preparing for Class 12 can use Goa Board Class 12 Syllabus 2027 Economics to understand the exam pattern, the type of questions asked, and the overall difficulty level.
Frequently Asked Questions
How can I download Goa Board Class 12 Syllabus 2027 Economics?
Open this page and click the Download button to save Goa Board Class 12 Syllabus 2027 Economics as a PDF. It is completely free on AglaSem Docs.
Is Goa Board Class 12 Syllabus 2027 Economics free to download?
Yes. Goa Board Class 12 Syllabus 2027 Economics can be viewed online and downloaded as a PDF free of cost on AglaSem Docs.
How many pages does Goa Board Class 12 Syllabus 2027 Economics have?
Goa Board Class 12 Syllabus 2027 Economics contains 13 pages, which you can read online or download together as a single PDF.
Where can I find more Class 12 study material?
You can find more Class 12 question papers, sample papers, syllabus, and answer keys on AglaSem Docs.
Goa Board Class 12 Syllabus 2027 Economics – Text
Read the full text of this syllabus below — useful to quickly search, copy and reference the content online without downloading the PDF.
📄 View text version (14 pages)
Page 1
Goa Board Class 12
Syllabus 2027
Economics
EXAM YEAR TYPE SUBJECT
Goa Class 12 2027 Syllabus Economics
Notes · Sample Papers · Previous Year Papers · Mock Tests
Page 2
m .co
m .co em
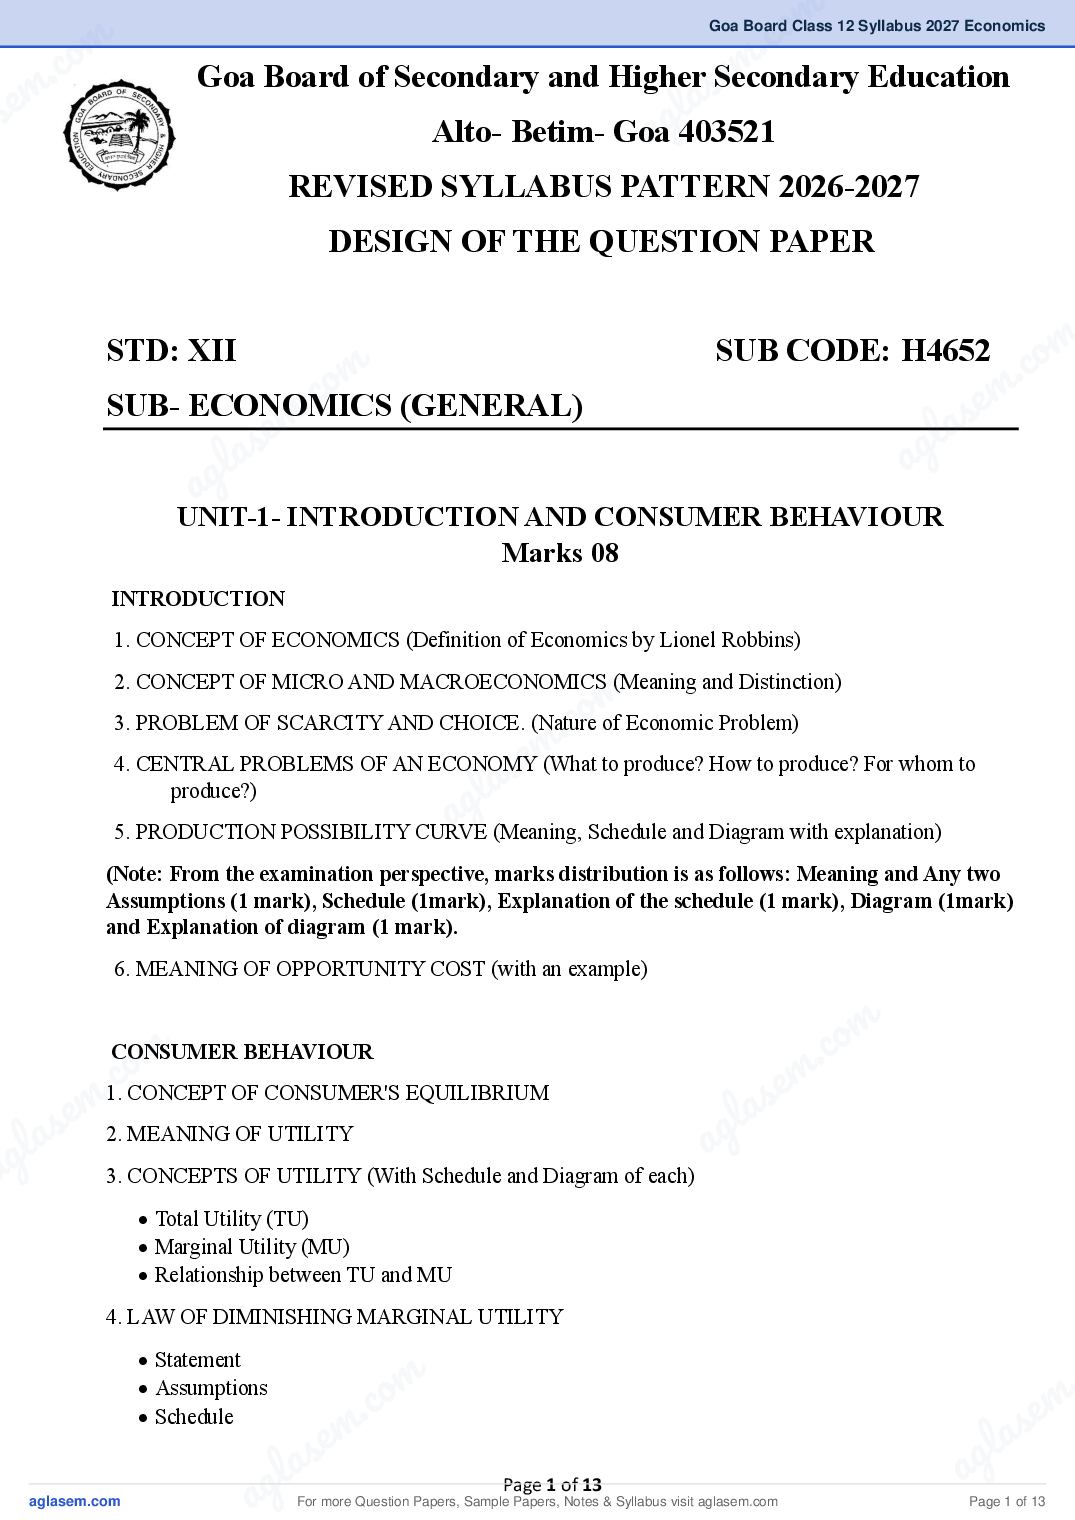
Goa Board of Secondary and Higher sSecondary Education
se g la
a 403521
Alto- Betim- Goa
REVISED SYLLABUS PATTERN 2026-2027
DESIGN OF THE QUESTION PAPER
m
.co
STD: XII SUB CODE: H4652
o m m
SUB- ECONOMICS . c (GENERAL) s e
e m l a
l as ag
ag
UNIT-1- INTRODUCTION AND CONSUMER BEHAVIOUR
Marks 08
INTRODUCTION
1. CONCEPT OF ECONOMICS (Definition of Economics by Lionel Robbins)
2. CONCEPT OF MICRO AND MACROECONOMICS (Meaning and Distinction)
m
.co
3. PROBLEM OF SCARCITY AND CHOICE. (Nature of Economic Problem)
s em
4. CENTRAL PROBLEMS OF AN ECONOMY (What to produce? How to produce? For whom to
produce?)
g la
a
5. PRODUCTION POSSIBILITY CURVE (Meaning, Schedule and Diagram with explanation)
(Note: From the examination perspective, marks distribution is as follows: Meaning and Any two
Assumptions (1 mark), Schedule (1mark), Explanation of the schedule (1 mark), Diagram (1mark)
and Explanation of diagram (1 mark).
6. MEANING OF OPPORTUNITY COST (with an example)
m
c o m
CONSUMER BEHAVIOUR
m.co
m . CONCEPT OF CONSUMER'S EQUILIBRIUM
1. s e
s e g l a
l a 2. MEANING OF UTILITY
a
ag 3. CONCEPTS OF UTILITY (With Schedule and Diagram of each)
• Total Utility (TU)
• Marginal Utility (MU)
• Relationship between TU and MU
4. LAW OF DIMINISHING MARGINAL UTILITY
• Statement
m .
.co
• Assumptions
e m
• Schedule
em l as
las ag
ag Page 1 of 13
For more Question Papers, Sample Papers, Notes & Syllabus visit Page 1 of 13
Page 3
• Explanation
(Note: From the examination perspective, marks distribution is as follows: Statement (1mark),
Any two Assumptions (1 mark), Schedule (1mark), Diagram (1mark) and Explanation (1 mark)
5. MEANING OF AN INDIFFERENCE SET (SCHEDULE)
6. MEANING OF AN INDIFFERENCE CURVE (With Diagram)
7. MEANING OF AN INDIFFERENCE MAP (With Diagram)
8. MEANING OF THE CONSUMER’S BUDGET
9. MEANING OF THE BUDGET SET (with an example)
10. MEANING OF THE BUDGET LINE (With Diagram)
11. MEANING OF MONOTONIC PREFERENCE (with an example.)
12. CONSUMER’S EQUILIBRIUM THROUGH INDIFFERENCE CURVE ANALYSIS (With
Diagram)
UNIT-2-DEMAND ANALYSIS
Marks 12
1. MEANING AND DETERMINANTS OF DEMAND
2. MEANING OF AN INDIVIDUAL DEMAND SCHEDULE AND DEMAND CURVE (With
Schedule and Diagram)
3. MEANING OF MARKET DEMAND SCHEDULE AND MARKET DEMAND CURVE (With
Schedule and Diagram)
4. THE LAW OF DEMAND
• Statement
• Assumptions
• Schedule
• Diagram
• Explanation
(Note: From the examination perspective, marks distribution is as follows: Statement (1 mark),
Assumptions any two (1 mark), Schedule (1mark), Diagram (1mark) and Explanation (1
mark)
5. EXCEPTIONS TO THE LAW OF DEMAND
6. MEANING OF NORMAL GOODS AND INFERIOR GOODS with examples (Income effect on
these goods)
7. MEANING OF SUBSTITUTES AND COMPLEMENTARY GOODS (with examples)
8. MOVEMENT ALONG THE DEMAND CURVE/ VARIATIONS IN DEMAND CURVE
• Extension or Expansion of Demand (With Diagram)
• Contraction of Demand (With Diagram)
Page 2 of 13
For more Question Papers, Sample Papers, Notes & Syllabus visit Page 2 of 13
Page 4
m 9. SHIFTS IN DEMAND/ CHANGE IN DEMAND .co
m .co s e m
se • Increase in Demand / Forward shift (With Diagram)
g l a
• Decrease in Demand/ Backward shift (With Diagram) a
10. MEANING AND DETERMINANTS OF PRICE ELASTICITY OF DEMAND
11. TYPES OF PRICE ELASTICITY OF DEMAND (meaning with diagram)
• Perfectly Elastic Demand (Ed = ∞)
• Perfectly Inelastic Demand (Ed = 0)
• Unit Elastic Demand (Ed = 1)
m
.co
• Relatively Elastic Demand (Ed > 1)
m
.co m
• Relatively Inelastic Demand (Ed < 1)
s e
em
12. MEASUREMENT OF PRICE ELASTICITY OF DEMAND
s l a
la Method
Only Percentage
g ag
Note:aFrom the examination perspective, the marks distribution for Problem Solving is as follows:
Step 1: Formula (1/2 mark)
Step 2: Calculating Percentage change in Qty. DD (1 mark)
Step 3: Calculating Percentage change in Price (1 mark)
Step 4: Substitution and final answer (1/2 mark)
m
.co
13. GEOMETRIC METHOD (With Diagram and formula, indicating 5 situations on the Demand
Curve)
e m
las
ag
UNIT-3-PRODUCER BEHAVIOUR AND SUPPLY
Marks 10
1. MEANING OF PRODUCTION FUNCTION
2. MEANING OF FIXED AND VARIABLE FACTORS
3. CONCEPTS OF PRODUCTION –
o m
om Product (TP), Average Product (AP) and Marginal Product (MP) (concepts c
.with formula only)
c. Total e m
e m 4. THE LAW OF VARIABLE PROPORTIONS l as
l as ag
ag
• Statement
• Assumptions
• Schedule
• Diagram
• Explanation of the three stages
(Note: From the examination perspective, marks distribution is as follows: Statement (1 mark),
Assumptions (1 mark), Schedule (1mark), Diagram (1mark) and Explanation of the three stages in
brief (1 mark)
m .
.co
5. RETURNS TO SCALE (Only three Stages of the law. No schedule and diagram)
s e m
s em l a
g la Page 3 of 13 ag
a For more Question Papers, Sample Papers, Notes & Syllabus visit Page 3 of 13
Page 5
(Fixed cost, Variable cost, TFC, TVC, AFC, AVC, TC, AC, MC)
TC =TFC + TVC (only based on this formula only, calculation for 1 or 2 marks can be asked)
7. CONCEPTS OF REVENUE- Meaning of various revenue concepts with formula only- (No
diagrams)
Total Revenue (TR), Average Revenue (AR), Marginal Revenue (MR)
8. MEANING OF SUPPLY
9. DETERMINANTS/ FACTORS INFLUENCING SUPPLY
10. LAW OF SUPPLY
• Statement
• Assumptions
• Supply Schedule
• Diagram
• Explanation
(Note: From the examination perspective, marks distribution is as follows: Statement (1mark),
Assumptions any two (1 mark), Schedule (1mark), Diagram (1mark) and Explanation (1 mark)
11. MEANING OF INDIVIDUAL SUPPLY SCHEDULE AND SUPPLY CURVE (With Schedule and
Diagram)
12. MEANING OF MARKET SUPPLY SCHEDULE AND MARKET SUPPLY CURVE (With
Schedule & Diagram)
13. MOVEMENTS ALONG THE SUPPLY CURVE/ VARIATIONS IN THE SUPPLY CURVE
• Extension / Expansion of supply (With Diagram)
• Contraction of supply (With Diagram)
14. SHIFTS IN THE SUPPLY CURVE/ CHANGE IN SUPPLY CURVE
• Increase in supply / Forward shift (With Diagram)
• Decrease in supply / Backward shift (With Diagram)
15. TYPES OF PRICE ELASTICITY OF SUPPLY (meaning with diagram)
• Relatively Elastic Supply (ES > 1)
• Relatively Inelastic Supply (ES < 1)
• Unit Elastic Supply (ES = 1)
16. MEASUREMENT OF PRICE ELASTICITY OF SUPPLY
Only Percentage Method
Note: From the examination perspective, the marks distribution for Problem Solving is as follows:
Step 1: Formula (1/2 mark)
Step 2: Calculating Percentage change in Qty. SS (1 mark)
Step 3: Calculating Percentage change in Price (1 mark)
Step 4: Substitution and final answer (1/2 mark)
Page 4 of 13
For more Question Papers, Sample Papers, Notes & Syllabus visit Page 4 of 13
Page 6
m .co
m .co UNIT-4-PRODUCER’S EQUILIBRIUM, PRICEem
s DETERMINATION
se gla
AND MARKET STRUCTURE
a
Marks 10
1. CONCEPT OF PRODUCER’S EQUILIBRIUM (Meaning only)
2. MEANING AND FEATURES OF PERFECT COMPETITION (Minimum five)
3. MEANING AND FEATURES OF MONOPOLY (Minimum five)
4. MEANING AND FEATURES OF MONOPOLISTIC COMPETITION (Minimum five)
m
o m
5. MEANING AND FEATURES OF OLIGOPOLY (Minimum five)
c m .co
6. DETERMINATION .OF EQUILIBRIUM PRICE UNDER PERFECT COMPETITION (With se
s em
Schedule and Diagram)
g l a
g lINa EQUILIBRIUM PRICE DUE TO SHIFTS IN DEMAND a
a
7. CHANGES
• Increase in demand, supply remaining constant (With Diagram)
• Decrease in demand, supply remaining constant (With Diagram)
8. CHANGES IN EQUILIBRIUM PRICE DUE TO SHIFTS IN SUPPLY
• Increase in supply, demand remaining constant (With Diagram)
m
• Decrease in supply, demand remaining constant (With Diagram)
o
9. DETERMINATION OF EQUILIBRIUM PRICE DUE c
. TO SIMULTANEOUS SHIFTS IN DEMAND
e m
AND SUPPLY
la s
• Demand and Supply increase in equalgproportion
a (With Diagram)
• Demand and supply decrease in equal proportion (With Diagram)
UNIT-5 NATIONAL INCOME AND RELATED AGGREGATES
MEASUREMENT OF NATIONAL INCOME
10 Marks
m
o m
1. MEANING OF MACROECONOMICS .co
m
c
. MEANING OF NATIONAL INCOME s em
s e
2.
g l a
l a 3. CIRCULAR FLOW OF NATIONAL INCOME – (2-sector model)a(With Diagram)
ag 4. MEANING OF AGGREGATES OF NATIONAL INCOME (With formula)
• GDP at MP (Gross Domestic Product at Market Prices)
• NDP at MP (Net Domestic Product at Market Prices)
• GNP at MP (Gross National Product at Market Prices)
• NNP at MP (Net National Product at Market Prices)
• GDP at FC (Gross Domestic Product at Factor Cost)
• NDP at FC (Net Domestic Product at Factor Cost)
m .
.co m
• GNP at FC (Gross National Product at Factor Cost)
s e
em
• NNP at FC (Net National Product at Factor Cost)
s l a
g la Page 5 of 13 ag
a For more Question Papers, Sample Papers, Notes & Syllabus visit Page 5 of 13
Page 7
• Private income
• Personal income
• Personal disposable income (calculation with example for MCQ)
6. VALUE-ADDED METHOD OR PRODUCT METHOD OF MEASUREMENT OF NATIONAL
INCOME
7. CALCULATION OF GROSS VALUE ADDED (value added method problem)
8. PRECAUTIONS WHILE ESTIMATING NATIONAL INCOME BY THE PRODUCT METHOD
9. MEANING OF DOUBLE COUNTING (With a Suitable Example)
10. INCOME METHOD OF MEASUREMENT OF NATIONAL INCOME
Classification of factor incomes (3 types of Incomes)
• Compensation of employees
• Mixed income
• Operating surplus
▪ Rent
▪ Interest
▪ Royalties
▪ Profit
• Corporate profit
• Undistributed profit
• Dividends
11. PRECAUTIONS WHILE ESTIMATING NATIONAL INCOME BY THE INCOME METHOD
12. EXPENDITURE METHOD OF MEASUREMENT OF NATIONAL INCOME
• Classification of final expenditure (4 types of final expenditure)
13. PRECAUTIONS WHILE ESTIMATING NATIONAL INCOME BY THE EXPENDITURE
METHOD
14. REASONS WHY GDP IS NOT A GOOD INDICATOR OF WELFARE.
A. Distribution of GDP
B. Composition of GDP
C. Non-monetary exchanges
D. Externalities (Positive and negative)
UNIT-6-DETERMINATION OF INCOME & EMPLOYMENT
Marks 10
1. MEANING AND COMPONENTS OF AGGREGATE DEMAND: AD = C + I + G + (X-M)
2. MEANING AND COMPONENTS OF AGGREGATE SUPPLY: AS = C + S
3. THE CONSUMPTION FUNCTION (Meaning, Schedule and Diagram)
4. PROPENSITY TO CONSUME
Page 6 of 13
For more Question Papers, Sample Papers, Notes & Syllabus visit Page 6 of 13
Page 8
m .co
m .co • Average Propensity to Consume (APC)
s e m
se • Marginal Propensity to Consume (MPC)
g l a
(APC & MPC- Meaning, formula and problems) a
5. THE SAVINGS FUNCTION (Meaning, Schedule and Diagram)
6. PROPENSITY TO SAVE
• Average Propensity to Save (APS)
• Marginal Propensity to Save (MPS)
(APS & MPS- Meaning, formula and problems)
m
o m
7. DETERMINATION OF EQUILIBRIUM LEVEL OF OUTPUT/ INCOME:
c m .co
. s e
s em
(GDP) (AS = AD APPROACH) (With schedule and Diagram)
g l a
8. MEANINGlOFa INVESTMENT MULTIPLIER OR OUTPUT MULTIPLIER (Meaning &aformula)
ag OF THE CONCEPT OF FULL EMPLOYMENT AND INVOLUNTARY
9. MEANING
UNEMPLOYMENT.
10. DEFICIENT DEMAND AT FULL EMPLOYMENT LEVEL (with diagram)
11. EXCESS DEMAND AT FULL EMPLOYMENT LEVEL (with diagram)
12. FISCAL POLICY: meaning,
• Measures to correct excess demand m
• Measures to correct deficient demand
m .co
s e
(Govt. Expenditure, Taxes, Public borrowings/public debt & Deficit financing)
g la
a
UNIT-7-MONEY AND BANKING
Marks 10
1. EVOLUTION OF MONEY- meaning, stages in the evolution of money
• (Animal money/ Commodity money, Metallic/coin money, Paper money, Bank money, Plastic money,
Digital Money) (not to be tested)
o m
o m c
OF MONEY, FUNCTIONS OF MONEY- PRIMARY FUNCTIONS. & SECONDARY
c
2. MEANING
. e m
em3. DEMAND FOR MONEY (liquidity preference)
FUNCTIONS
l as
las ag
ag • Transaction Motive
• Precautionary Motive
• Speculative Motive
4. SUPPLY OF MONEY
• Measurement of Money Supply (M1, M2, M3 and M4)
5. MEANING OF A COMMERCIAL BANK, PRIMARY FUNCTIONS OF A COMMERCIAL BANK-
m .
.co
Accepting deposits and advancing loans
e m
em l as
las ag
ag Page 7 of 13
For more Question Papers, Sample Papers, Notes & Syllabus visit Page 7 of 13
Page 9
7. MEANING OF PRIMARY DEPOSITS AND SECONDARY DEPOSITS, (Meaning only)
8. MEANING AND FUNCTIONS OF THE CENTRAL BANK
9. DISTINCTION BETWEEN CENTRAL BANK AND COMMERCIAL BANKS (2 points)
10. QUANTITATIVE INSTRUMENTS/Tools of the monetary policy of the central Bank to control
credit
11. QUALITATIVE INSTRUMENTS/Tools of the monetary policy of the central bank to control credit
UNIT-8-GOVERNMENT BUDGET AND FOREIGN EXCHANGE
RATE AND BALANCE OF PAYMENTS
Marks 10
1. GOVERNMENT BUDGET- meaning and objectives.
2. CLASSIFICATION OF RECEIPTS (budgetary receipts)- meaning,
• Revenue receipts- tax receipts and non-tax receipts (meaning)
Tax receipts classification
i. Progressive and Regressive Taxes
ii. VAT & Specific Taxes
iii. Direct and Indirect Taxes
iv. GST
Meaning, types of non-tax receipts
(Non-tax receipts- Fees, Fines, escheat, special Assessment, grants and donations, income from public
enterprises, income from sale of spectrum.)
• Capital receipts- (Meaning)
• Sources of Capital Receipts- Govt. Borrowings, Recovery of loans, Other Receipts.
3. CLASSIFICATION OF EXPENDITURE/ BUDGETARY EXPENDITURE
• Revenue Expenditure – meaning & examples
• Capital Expenditure - meaning & examples
4. CLASSIFICATION OF PUBLIC EXPENDITURE
• Development & Non-Development Expenditure
5. TYPES OF DEFICITS (ONLY MEANING)
• Revenue Deficit
• Fiscal Deficit
• Primary Deficit
6. TYPES OF BUDGETS (ONLY MEANING)
• Balanced Budget
• Surplus Budget
Page 8 of 13
For more Question Papers, Sample Papers, Notes & Syllabus visit Page 8 of 13
Page 10
m .co
m .co • Deficit Budget
s e m
se 7. MEASURES TO CURTAIL BUDGETARY DEFICITS
g l a
• Lowering Government Expenditure
a
• Raising Government Receipts
8. MEANING OF FOREIGN EXCHANGE RATE
9. MEANING OF FIXED EXCHANGE RATE
10. MEANING OF FLEXIBLE EXCHANGE RATE
m
.co
11. DETERMINATION OF THE EXCHANGE RATE THROUGH THE DEMAND FOR AND
SUPPLY OF FOREIGN EXCHANGE
o m m
c
. for Foreign Exchange (5 components) s e
m
e of Foreign Exchange (5 components)
• Meaning - Demand
l a
a s
• Meaning- Supply
l of Equilibrium Rate of Exchange (with diagram) ag
ag
• Determination
(Note: From the examination perspective, the marks distribution is as follows:
• Meaning (1/2 mark)
• Demand for Foreign Exchange (1mark), (any two components)
• Supply of Foreign Exchange (1 mark), (any two components)
• Diagram (1mark)
• Explanation (1 1/2 marks) (equilibrium exchange rate (1/2 mark), Appreciation (1/2 mark) and
depreciation (1/2mark)
o m
c
. EXCHANGE MARKET
m
12. MEANING AND FUNCTIONS OF THE FOREIGN
e APPRECIATION AND DEPRECIATION
la
13. MEANING OF IMPORTANT CONCEPTS s LIKE
ag
14. PURCHASING POWER PARITY (meaning only)
15. MEANING OF BALANCE OF PAYMENT ACCOUNTS
16. COMPONENTS OF BALANCE OF PAYMENT ACCOUNT (current account & capital account)
m
m .co
m .co s e m
s e g l a
g la a
a
m .
.co s e m
s em l a
g la Page 9 of 13 ag
a For more Question Papers, Sample Papers, Notes & Syllabus visit Page 9 of 13
Page 11
SERIAL
LEARNING OBJECTIVE WEIGHTAGE (%) MARKS
NUMBER
1 KNOWLEDGE 25 20
2 UNDERSTANDING 55 44
3 APPLICATION 20 16
TOTAL 100 80
2.WEIGHTAGE TO CONTENT (1ST MID TERM EXAMINATION)
SERIAL WEIGHTAGE
TOPIC/UNIT MARKS
NUM (%)
INTRODUCTION AND
1
CONSUMER BEHAVIOUR
40 08
2 DEMAND ANALYSIS 60 12
TOTAL 100 20
3.WEIGHTAGE TO CONTENT (FIRST TERMINAL EXAMINATION)
UNIT WEIGHTAGE
TOPIC/UNIT MARKS
NUM (%)
INTRODUCTION AND CONSUMER
1 BEHAVIOUR
18.75 15
2 DEMAND ANALYSIS 25 20
3 PRODUCER BEHAVIOUR AND SUPPLY 25 20
PRODUCER’S EQUILIBRIUM, PRICE
4 DETERMINATION AND FORMS OF MARKET
18.75 15
7 MONEY AND BANKING 12.5 10
TOTAL 100 80
Page 10 of 13
For more Question Papers, Sample Papers, Notes & Syllabus visit Page 10 of 13
Page 12
m .co
c. o 4.WEIGHTAGE TO CONTENT (GOA BOARD EXAMINATION)sem
m la
se SERIAL
TOPIC/ UNIT
g
a WEIGHTAGE (%) MARKS
NUM
UNIT 1
1 INTRODUCTION AND CONSUMER BEHAVIOUR
10 8
UNIT 2
2 DEMAND ANALYSIS
15 12
UNIT 3
3 PRODUCER BEHAVIOUR AND SUPPLY
12.5 10
UNIT 4 m
4 m
PRODUCER’S EQUILIBRIUM, PRICE 12.5 10 .co
.co
DETERMINATION AND MARKET STRUCTURE
m s e m
UNIT 5
s e l a
ag10
NATIONAL INCOME AND RELATED 12.5
5
g l a
AGGREGATES- MEASUREMENTS OF
a
NATIONAL INCOME
UNIT 6
DETERMINATION OF INCOME AND
6 EMPLOYMENT
12.5 10
UNIT 7
7 MONEY AND BANKING
12.5 10
UNIT 8
8 GOVERNMENT BUDGET, FOREIGN EXCHANGE m 12.5 10
RATE AND BALANCE OF PAYMENT c. o
e m 100 80
TOTAL
las
ag
5.WEIGHTAGE TO TYPE OF QUESTIONS (1ST MID TERM EXAMINATION)
NUMBER
MARKS WEIGH TIME
SERIAL TYPE OF OF
PER MARKS TAGE ALLOTTE
NUM QUESTION QUESTION
QUESTION (%) D
S
m
.co
1 OBJECTIVE TYPE 1 3 3 15 9
. c om e m
e m 2 SHORT ANSWER
2 3 6 a
l s 30 18
las TYPE 1
ag
ag 3
SHORT ANSWER
3 2 6 30 18
TYPE 2
4 LONG ANSWER 5 1 5 25 15
9 20 100 60 MIN
m .
.co s e m
s em l a
g la Page 11 of 13 ag
a For more Question Papers, Sample Papers, Notes & Syllabus visit Page 11 of 13
Page 13
MARKS NUMBER
SERIAL TYPE OF WEIGHTAGE TIME
PER OF MARKS
NUM QUESTION (%) ALLOTTED
QUESTION QUESTIONS
OBJECTIVE
1
TYPE
1 20 20 25 30
SHORT
2
2 ANSWER 6 12 15 24
TYPE 1
SHORT
3 ANSWER 3 6 18 22.5 48
TYPE 2
LONG
4
ANSWER
5 6 30 37.5 78
TOTAL 38 80 100 180
7.WEIGHTAGE TO LEVEL OF DIFFICULTY
SERIAL LEVEL OF WEIGHTAGE MARKS
NUM DIFFICULTY (%)
1 EASY 25 20
2 AVERAGE 55 44
3 DIFFICULT 20 16
TOTAL 100 80
8.QUESTION FOR CHOICE
SERIAL
UNIT MARKS
NUM
1 UNIT IV 3 MARKS
2 UNIT V 3 MARKS
3 UNIT II 5 MARKS
4 UNIT VII 5 MARKS
Page 12 of 13
For more Question Papers, Sample Papers, Notes & Syllabus visit Page 12 of 13
Page 14
m .co
m .co s e m
se g l a
a
9. SAMPLE BLUE PRINT
m
m .co
m .co s e m
s e l a
g l a ag
a
m
m .co
s e
g la
a
m
m .co
m .co s e m
s e g l a
g la a
a
m .
.co s e m
s em l a
g la Page 13 of 13 ag
a For more Question Papers, Sample Papers, Notes & Syllabus visit Page 13 of 13
Document Details
| Board / Org | Goa Board |
| Exam | Class 12 |
| Type | Syllabus |
| Pages | 13 |
| Updated | 04 Nov 2026 |