TBSE Class 11 Model Question Paper for 2021 Economics
Finished viewing? Save it for later —
Download TBSE Class 11 Model Question Paper for 2021 Economics (PDF · 3 pages)About TBSE Class 11 Model Question Paper for 2021 Economics
TBSE Class 11 Model Question Paper for 2021 Economics is available here for free download. Published by Tripura Board for Class 11, this sample paper can be viewed online or downloaded as a PDF (3 pages). Candidates preparing for Class 11 can use TBSE Class 11 Model Question Paper for 2021 Economics to understand the exam pattern, the type of questions asked, and the overall difficulty level.
Frequently Asked Questions
How can I download TBSE Class 11 Model Question Paper for 2021 Economics?
Open this page and click the Download button to save TBSE Class 11 Model Question Paper for 2021 Economics as a PDF. It is completely free on AglaSem Docs.
Is TBSE Class 11 Model Question Paper for 2021 Economics free to download?
Yes. TBSE Class 11 Model Question Paper for 2021 Economics can be viewed online and downloaded as a PDF free of cost on AglaSem Docs.
How many pages does TBSE Class 11 Model Question Paper for 2021 Economics have?
TBSE Class 11 Model Question Paper for 2021 Economics contains 3 pages, which you can read online or download together as a single PDF.
Where can I find more Class 11 study material?
You can find more Class 11 question papers, sample papers, syllabus, and answer keys on AglaSem Docs.
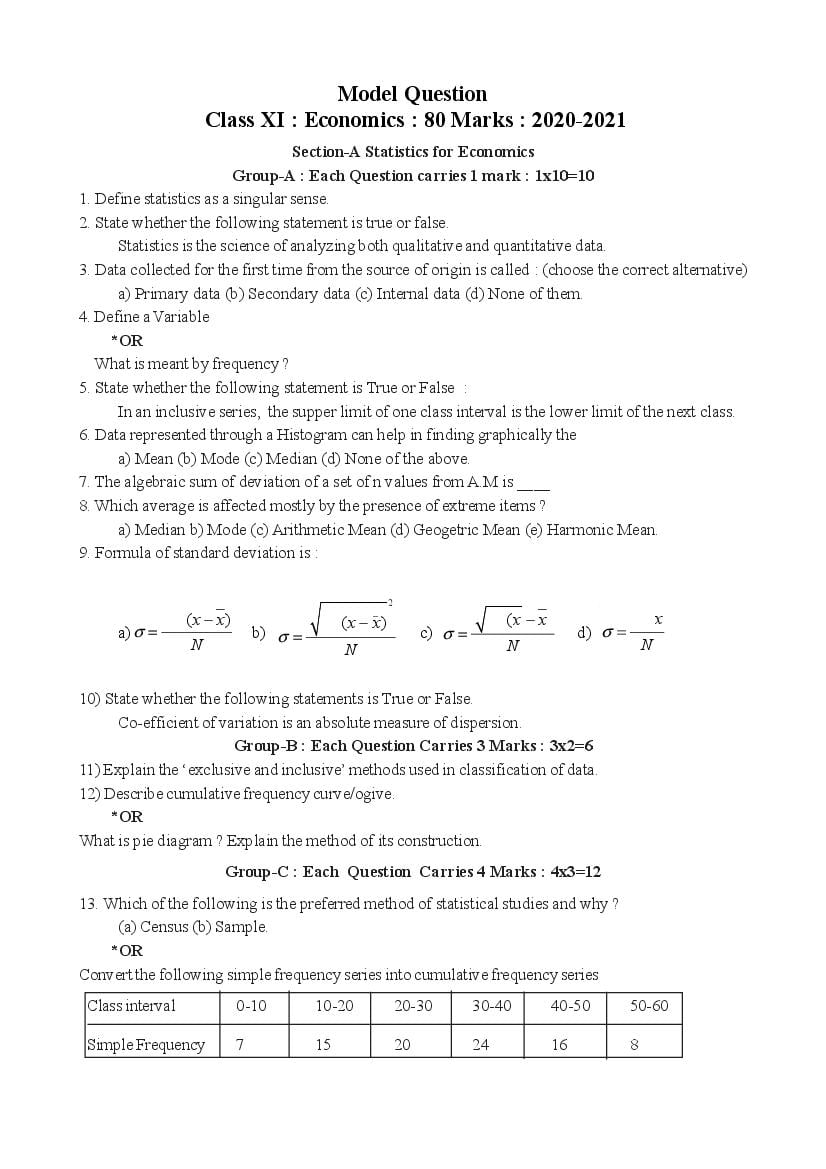
TBSE Class 11 Model Question Paper for 2021 Economics – Text
Read the full text of this sample paper below — useful to quickly search, copy and reference the content online without downloading the PDF.
📄 View text version (3 pages)
Page 1
Class XI : Economics : 80 Marks : 2020-2021
Section-A Statistics for Economics
Group-A : Each Question carries 1 mark : 1x10=10
1. Define statistics as a singular sense.
2. State whether the following statement is true or false.
Statistics is the science of analyzing both qualitative and quantitative data.
3. Data collected for the first time from the source of origin is called : (choose the correct alternative)
a) Primary data (b) Secondary data (c) Internal data (d) None of them.
4. Define a Variable
*OR
What is meant by frequency ?
5. State whether the following statement is True or False :
In an inclusive series, the supper limit of one class interval is the lower limit of the next class.
6. Data represented through a Histogram can help in finding graphically the
a) Mean (b) Mode (c) Median (d) None of the above.
7. The algebraic sum of deviation of a set of n values from A.M is ____
8. Which average is affected mostly by the presence of extreme items ?
a) Median b) Mode (c) Arithmetic Mean (d) Geogetric Mean (e) Harmonic Mean.
9. Formula of standard deviation is :
2
−
( x − x) ( x − x) (x − x x
a) σ = b) σ = c) σ = d) σ =
N N N N
10) State whether the following statements is True or False.
Co-efficient of variation is an absolute measure of dispersion.
Group-B : Each Question Carries 3 Marks : 3x2=6
11) Explain the ‘exclusive and inclusive’ methods used in classification of data.
12) Describe cumulative frequency curve/ogive.
*OR
What is pie diagram ? Explain the method of its construction.
Group-C : Each Question Carries 4 Marks : 4x3=12
13. Which of the following is the preferred method of statistical studies and why ?
(a) Census (b) Sample.
*OR
Convert the following simple frequency series into cumulative frequency series
Class interval 0-10 10-20 20-30 30-40 40-50 50-60
Simple Frequency 7 15 20 24 16 8
Page 2
150 families.
Income More than More than More More More than More than More More
( Rs.) 75 85 than than 115 125 than than
95 105 135 145
Number of
families 150 140 115 95 70 60 40 25
15. Describe the relationship among mean, median and mode.
Group-D : Each Question Carries 6 Marks : 6x2=12
16. How is a frequency polygon different from a frequency curve ? Draw the two diagrams taking an
imaginary set of data.
OR
Differentiate between Histogram and Bar diagram.
17. Calculate standard deviationn (S.D) of marks secured by 100 examinees :
Marks 10-20 20-30 30-40 40-50 50-60 60-70 70-80 80-90
Number of
Examiness 19 3 2 49 24 2 0 1
Section -B : Micro Economics
Group-E : Each Question Carries 1 Mark : 1x10=10
18. State one example of positive economics.
19. State, whether the following statements is True or False.
Price determination of a commodity is a subject matter of Macro economics.
20. Due to rise in price of the commodity x, the demand of the commodity y falls. What type of
commodity they are ?
21. Which of the following can be referred to as point of Satiety or Saturation ?
a) MU is negative (b) MU is zero (c) TU is rising (d) TU is falling.
22. What is meant by prefectly Elastic Demand ?
23. Define Marginal Product.
* OR
Can Marginal product be zero or negative?
24. Under what circumstances, variable cost is zero ?
26. When 5 units of a good are sold, total revenue is Rs. 100. When 6 units are sold, marginal revenue
is Rs. 8. At what price are 6 units sold ?
a) Rs. 28 per unit (b) Rs. 20 per unit (c) Rs. 18 per unit (d) Rs. 12 per unit.
27. Demand curve of a perfectly competitive firm is :
a) Perfectly inelasitc (b) Inelastic (c) Elastic (d) Perfectly elastic.
Page 3
28. Define Marginal Utility (MU). Explain the relationship between total utility (TU) and Marginal
Utility (MU). Use diagram. 1+2
*OR
Define demand State any three causes of a rightward shift of demand curve. 1+2
29. Calculate marginal cost at each level of output.
Output (units) Average variable cost (Rs.)
1 13
2 11
3 10
4 10
5 11
6 12
Group- G : Each Question Carries 4 Marks : 4x3=12
30. Explain the problem of ‘What to produce’ with the help of an example.
31. State the different phase of change in total product according to the Law of variable proportion.
Use diagram.
*OR
Define cost. State relation between marginal cost and average variable cost. Use diagram. 1+3
32. What is elasticity of supply ? Price elasticity of supply of a commodity is 2.A firm supplies 200 units
of it at a price of Rs. 8 per unit. At what price will it supply 250 units ? 2+2
Group-H : Each Question Carries 6 Marks : 6x2=12
33. Define consumer’s equilibrium. A consumer consumes only two goods. Explain consumer’s
equilibrium with the help of utility analysis. 2+4
OR
Explain the difference between ‘change in demand’ and change in quantity demanded. Use diagram.
34. What is abnormal profit ? Explain the determination of abnormal profit under short run equilibrium
in perfectly competitive market. Use diagram. 2+4
* Additional Questions