NBSE Class 11 Question Paper 2021 for Economics
Finished viewing? Save it for later —
Download NBSE Class 11 Question Paper 2021 for Economics (PDF · 3 pages)About NBSE Class 11 Question Paper 2021 for Economics
NBSE Class 11 Question Paper 2021 for Economics is available here for free download. Published by Nagaland Board for Class 11, this question paper can be viewed online or downloaded as a PDF (3 pages). Candidates preparing for Class 11 can use NBSE Class 11 Question Paper 2021 for Economics to understand the exam pattern, the type of questions asked, and the overall difficulty level.
Frequently Asked Questions
How can I download NBSE Class 11 Question Paper 2021 for Economics?
Open this page and click the Download button to save NBSE Class 11 Question Paper 2021 for Economics as a PDF. It is completely free on AglaSem Docs.
Is NBSE Class 11 Question Paper 2021 for Economics free to download?
Yes. NBSE Class 11 Question Paper 2021 for Economics can be viewed online and downloaded as a PDF free of cost on AglaSem Docs.
How many pages does NBSE Class 11 Question Paper 2021 for Economics have?
NBSE Class 11 Question Paper 2021 for Economics contains 3 pages, which you can read online or download together as a single PDF.
Where can I find more Class 11 study material?
You can find more Class 11 question papers, sample papers, syllabus, and answer keys on AglaSem Docs.
NBSE Class 11 Question Paper 2021 for Economics – Text
Read the full text of this question paper below — useful to quickly search, copy and reference the content online without downloading the PDF.
📄 View text version (3 pages)
Page 1
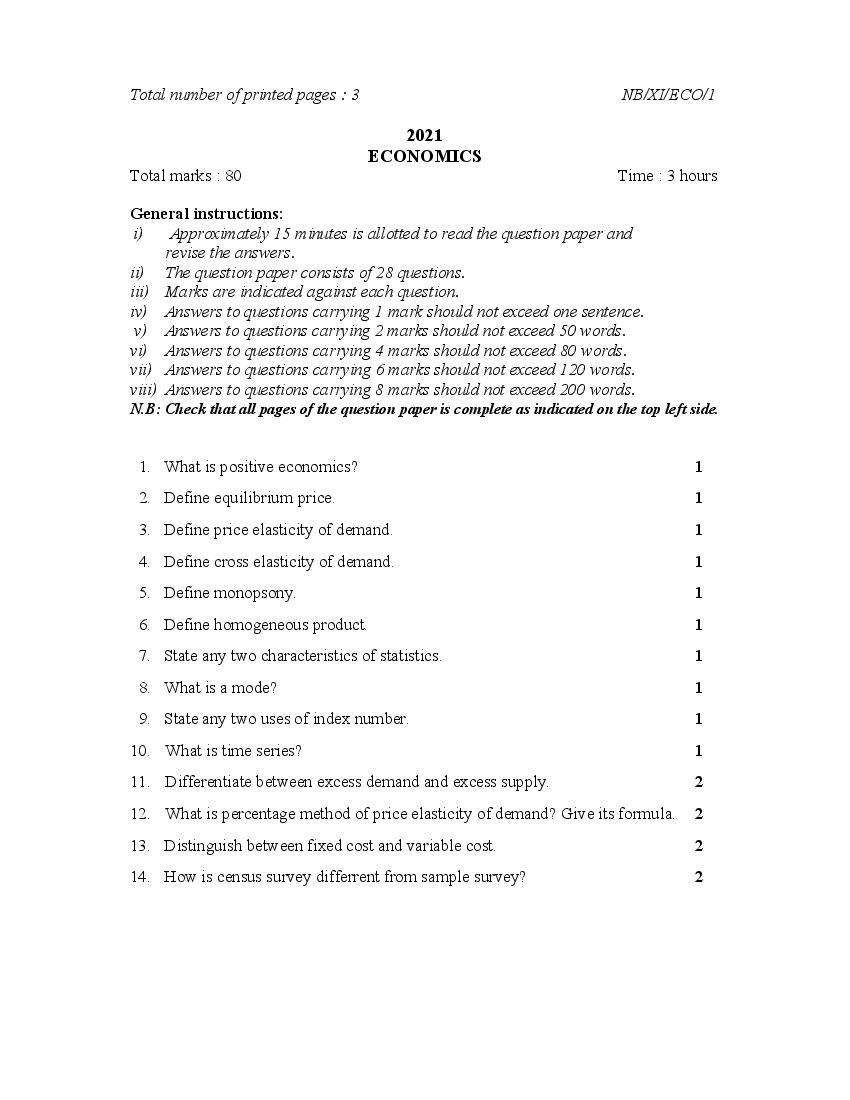
2021
ECONOMICS
Total marks : 80 Time : 3 hours
General instructions:
i) Approximately 15 minutes is allotted to read the question paper and
revise the answers.
ii) The question paper consists of 28 questions.
iii) Marks are indicated against each question.
iv) Answers to questions carrying 1 mark should not exceed one sentence.
v) Answers to questions carrying 2 marks should not exceed 50 words.
vi) Answers to questions carrying 4 marks should not exceed 80 words.
vii) Answers to questions carrying 6 marks should not exceed 120 words.
viii) Answers to questions carrying 8 marks should not exceed 200 words.
N.B: Check that all pages of the question paper is complete as indicated on the top left side.
1. What is positive economics? 1
2. Define equilibrium price. 1
3. Define price elasticity of demand. 1
4. Define cross elasticity of demand. 1
5. Define monopsony. 1
6. Define homogeneous product. 1
7. State any two characteristics of statistics. 1
8. What is a mode? 1
9. State any two uses of index number. 1
10. What is time series? 1
11. Differentiate between excess demand and excess supply. 2
12. What is percentage method of price elasticity of demand? Give its formula. 2
13. Distinguish between fixed cost and variable cost. 2
14. How is census survey differrent from sample survey? 2
Page 2
15. Distinguish between continuous variable and discrete variable. 2
16. Explain any two central problems of an economy. 4
17 State any four causes for decrease in supply. 4
18. Explain the condition of consumer’s equilibrium in case of two commodities. 4
19. Explain any two limitations of statistics. 4
20. Calculate weighted mean by weighing each price by the quantity consumed: 4
Product Quantity consumed Price
(in units) (in )
Flour 25 Kgs 12
Butter 3 Kgs 85
Clothes 8 metres 250
Petrol 6 litres 44
Electricity 26 units 5
Answer any two from questions 21 – 23. 2x6=12
21. Explain any three degrees of elasticity of supply with the help of diagrams.
22. Explain the condition of producer’s equilibrium under MR – MC approach with
the help of a diagram.
23. Explain any four features of oligopoly.
Answer any two from questions 24 – 26. 2x6=12
24. State any six characteristics of a good table.
25. Draw Ogive ( Less than and More than) for the following frequency distribution.
Marks 0 – 10 10 – 20 20 – 30 30 – 40 40 -50 50 - 60
Number of 6 4 5 10 12 3
Students
26. From the following data, calculate Karl Pearson’s coefficient of correlation
between experience of employees and their performance.
Experience 16 12 18 4 3 10 5 12
Performance 23 22 24 17 19 20 18 21
Page 3
27. a. Explain change in quantity demanded and change in demand with the help
of a diagram. 4+4=8
Or
b. Explain the law of supply with the help of a schedule and diagram. (8)
28. a. Calculate median, first quartile and third quartile from the following
frequency distribution. 3 + 2½ + 2½ =8
Size Frequency
0 – 10 5
10 – 20 8
20 – 30 7
30 – 40 12
40 – 50 28
50 – 60 20
60 – 70 10
70 – 80 10
Or
b. From the following frequency distribution table, calculate the modal value
using 3 Median – 2 Mean. (4 + 3 + 1 =8)
Marks 0 – 10 10 – 20 20 – 30 30 – 40 40 – 50
No. of students 5 15 20 20 32
*************************