Manipur Board Class 11 Syllabus 2027 Statistics
Finished viewing? Save it for later —
Download Manipur Board Class 11 Syllabus 2027 Statistics (PDF · 3 pages)About Manipur Board Class 11 Syllabus 2027 Statistics
Manipur Board Class 11 Syllabus 2027 Statistics is available here for free download. Published by Manipur Board for Class 11, this syllabus can be viewed online or downloaded as a PDF (3 pages). Candidates preparing for Class 11 can use Manipur Board Class 11 Syllabus 2027 Statistics to understand the exam pattern, the type of questions asked, and the overall difficulty level.
Frequently Asked Questions
How can I download Manipur Board Class 11 Syllabus 2027 Statistics?
Open this page and click the Download button to save Manipur Board Class 11 Syllabus 2027 Statistics as a PDF. It is completely free on AglaSem Docs.
Is Manipur Board Class 11 Syllabus 2027 Statistics free to download?
Yes. Manipur Board Class 11 Syllabus 2027 Statistics can be viewed online and downloaded as a PDF free of cost on AglaSem Docs.
How many pages does Manipur Board Class 11 Syllabus 2027 Statistics have?
Manipur Board Class 11 Syllabus 2027 Statistics contains 3 pages, which you can read online or download together as a single PDF.
Where can I find more Class 11 study material?
You can find more Class 11 question papers, sample papers, syllabus, and answer keys on AglaSem Docs.
Manipur Board Class 11 Syllabus 2027 Statistics – Text
Read the full text of this syllabus below — useful to quickly search, copy and reference the content online without downloading the PDF.
📄 View text version (4 pages)
Page 1
Manipur Board Class
11 Syllabus 2027
Statistics
EXAM YEAR TYPE SUBJECT
Manipur Class 11 2027 Syllabus Statistics
Notes · Sample Papers · Previous Year Papers · Mock Tests
Page 2
m .co
m .co s em
se a
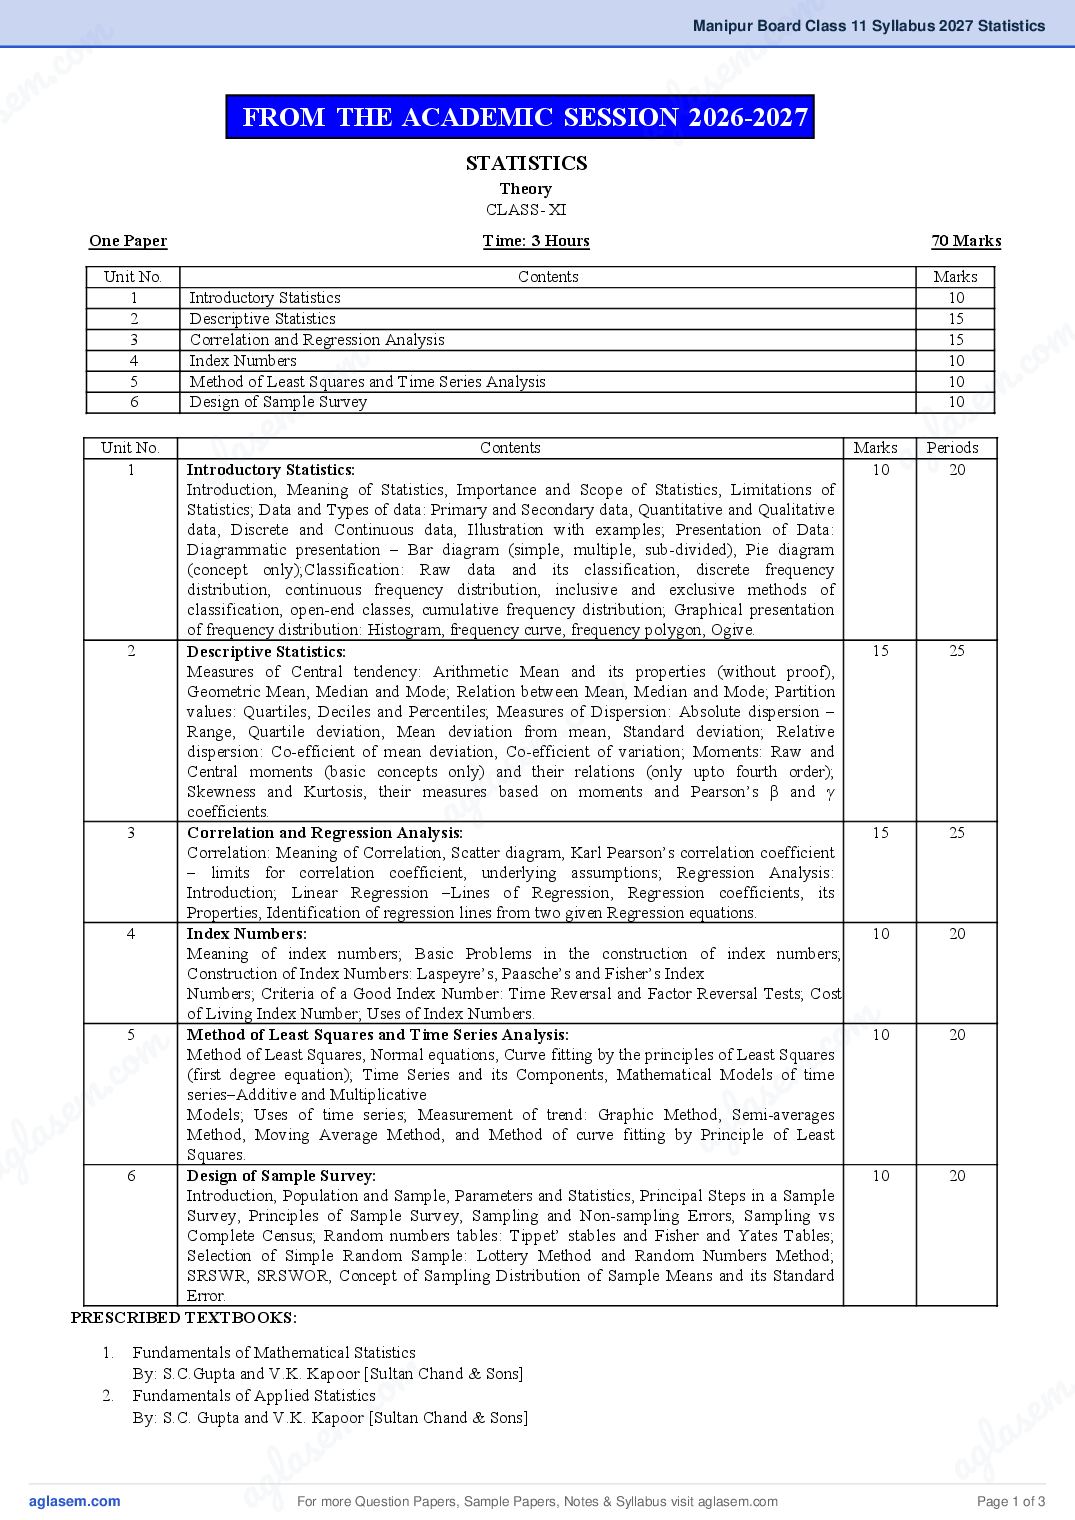
FROM THE ACADEMIC SESSIONgl2026-2027
a
Theory
CLASS- XI
One Paper Time: 3 Hours 70 Marks
Unit No. Contents Marks
1 Introductory Statistics 10
2 Descriptive Statistics 15
3 Correlation and Regression Analysis 15
m
4 Index Numbers
m 10
.co
.co m
5 Method of Least Squares and Time Series Analysis 10
e
las
6 Design of Sample Survey 10
s em Marks g
Unit No.
1 l a Contents
g Meaning of Statistics, Importance and Scope of Statistics, Limitations of
Introductory Statistics: 10 a
Periods
20
a
Introduction,
Statistics; Data and Types of data: Primary and Secondary data, Quantitative and Qualitative
data, Discrete and Continuous data, Illustration with examples; Presentation of Data:
Diagrammatic presentation – Bar diagram (simple, multiple, sub-divided), Pie diagram
(concept only);Classification: Raw data and its classification, discrete frequency
distribution, continuous frequency distribution, inclusive and exclusive methods of
classification, open-end classes, cumulative frequency distribution; Graphical presentation
of frequency distribution: Histogram, frequency curve, frequency polygon, Ogive.
2 Descriptive Statistics: 15 25
Measures of Central tendency: Arithmetic Mean and its properties (without proof),
m
Geometric Mean, Median and Mode; Relation between Mean, Median and Mode; Partition
.co
values: Quartiles, Deciles and Percentiles; Measures of Dispersion: Absolute dispersion –
Range, Quartile deviation, Mean deviation from mean, Standard deviation; Relative
e m
dispersion: Co-efficient of mean deviation, Co-efficient of variation; Moments: Raw and
las
Central moments (basic concepts only) and their relations (only upto fourth order);
coefficients.
ag
Skewness and Kurtosis, their measures based on moments and Pearson’s β and γ
3 Correlation and Regression Analysis: 15 25
Correlation: Meaning of Correlation, Scatter diagram, Karl Pearson’s correlation coefficient
– limits for correlation coefficient, underlying assumptions; Regression Analysis:
Introduction; Linear Regression –Lines of Regression, Regression coefficients, its
Properties, Identification of regression lines from two given Regression equations.
4 Index Numbers: 10 20
Meaning of index numbers; Basic Problems in the construction of index numbers;
Construction of Index Numbers: Laspeyre’s, Paasche’s and Fisher’s Index
Numbers; Criteria of a Good Index Number: Time Reversal and Factor Reversal Tests; Cost
of Living Index Number; Uses of Index Numbers.
m
5
m
Method of Least Squares and Time Series Analysis:
c. o 10 20
.co
Method of Least Squares, Normal equations, Curve fitting by the principles of Least Squares
(first degree equation); Time Series and its Components, Mathematical Models of time
e m
e m series–Additive and Multiplicative
l as
las Models; Uses of time series; Measurement of trend: Graphic Method, Semi-averages
Method, Moving Average Method, and Method of curve fitting by Principle of Least
ag
ag 6
Squares.
Design of Sample Survey: 10 20
Introduction, Population and Sample, Parameters and Statistics, Principal Steps in a Sample
Survey, Principles of Sample Survey, Sampling and Non-sampling Errors, Sampling vs
Complete Census; Random numbers tables: Tippet’ stables and Fisher and Yates Tables;
Selection of Simple Random Sample: Lottery Method and Random Numbers Method;
SRSWR, SRSWOR, Concept of Sampling Distribution of Sample Means and its Standard
Error.
PRESCRIBED TEXTBOOKS:
1. Fundamentals of Mathematical Statistics
m
By: S.C.Gupta and V.K. Kapoor [Sultan Chand & Sons]
.
.co m
2. Fundamentals of Applied Statistics
s e
em
By: S.C. Gupta and V.K. Kapoor [Sultan Chand & Sons]
s l a
a For more Question Papers, Sample Papers, Notes & Syllabus visit Page 1 of 3
Page 3
CLASS–XI
Time: 3 Hours 30 Marks
LIST OF PRACTICALS
1. Construction of frequency distribution from a given raw data.
2. Diagrammatic representation of statistical data based on simple, multiple, sub-divided bar diagrams and pie
diagram.
3. Graphical representation of statistical data (Histogram, Frequency curve, Frequency Polygon, Ogive).
4. Computation of measures of central tendency and dispersion.
5. Computation of coefficient of variation of a given frequency distribution and its interpretation.
6. Computation of first four Moments, measures of Skewness and Kurtosis.
7. Finding of Karl Pearson’s correlation coefficient for a bivariate data.
8. Simple linear regression.
9. Tests based on Laspeyre’s, Paasche’s, Fisher’s index numbers and test for ideal index number (Fisher’s
index number)–Factor and time reversal tests.
10. Test based on construction of Cost of Living index number.
11. Fitting of trend by Moving Average Method (both odd and even).
12. Drawing of Simple random sample of size10 from a statistical population of size 50 using random number table.
NOTE: Components of Practical.
1. To attempt any 3 (three) experiments out of 5 (five) experiments. (3×7=21 marks)
2. Note Book. (5 marks)
3. Viva–voce (4 marks)
Total: 30 marks
For more Question Papers, Sample Papers, Notes & Syllabus visit Page 2 of 3
Page 4
m .co
m .co s e m
se g l a
a
DESIGN OF
QUESTION PAPER
Subject : STATISTICS
Paper : Theory
Class : XI
m
.co
Full Mark : 70
m Time : 3 Hours
.co m
WEIGHTAGE TO OBJECTIVES
m
Objectives Marks
s
Percentage e
e
Knowledge (K)
s
10
l
14a
I
g l aUnderstanding (U)
Application (A)
35
21 ag 50
30
a Skill(S)
Total:
4
70
6
100
WEIGHTAGE TO FORMS OF QUESTIONS:
No. of Time (in
Form of Questions Marks Percentage
Question minute)
Essay/Long Answer (E/LA) 3 39 15 21
II Short Answer (SA-I) 6 46 18 26
Short Answer (SA-II) 10 51 20 29
Very Short Answer (VSA) 7 18 7 10
MCQ 10 26 10 14
Total: 36
m 180 70 100
.co
WEIGHTAGE TO CONTENT:
UNIT CONTENTS
e m Marks Percentage
1
2
Introductory Statistics
Description Statistics
las 10
15
14
22
III 3
4 Index Numbers ag
Correlation and Regression Analysis 15
10
22
14
5 Method of least Squares and Time Series Analysis 10 14
6 Design of Sample Survey 10 14
Total : 70 100
IV SCHEME OF SECTIONS : NIL
SCHEME OF OPTIONS :i) Internal option will be given in 2 (two) Essay Type Questions
V ii) Internal option will be given in 3 (three) Questions of SA-I
including one case study/source based question.
DIFFICULTY LEVEL :
VI Difficult : 30% of total mark
Average : 50% of total mark
m
m Easy : 20% of total mark
.co
m .co s
Special Instruction: 1) Two questions of MCQ will be assertion-reason type question. e m
s e l a
2) One question of SA-I will be case study/source based question.
g
la
3) First option will be (a) & second option will be (b) in the internal
g
option a
a
Abbreviation : K (Knowledge), U (Understanding), A (Application ), Skill (S), E (Essay Type),
SA (Short Answer Type), VSA (Very Short Answer Type),
MCQ (Multiple Choice Question)
m .
.co s e m
s em l a
a For more Question Papers, Sample Papers, Notes & Syllabus visit Page 3 of 3
Document Details
| Board / Org | Manipur Board |
| Exam | Class 11 |
| Type | Syllabus |
| Pages | 3 |
| Updated | 04 Nov 2026 |