Class 11 Sample Paper 2022 Economics Term 2
Finished viewing? Save it for later —
Download Class 11 Sample Paper 2022 Economics Term 2 (PDF · 4 pages)About Class 11 Sample Paper 2022 Economics Term 2
Class 11 Sample Paper 2022 Economics Term 2 is available here for free download. Published by AglaSem for Class 11, this sample paper can be viewed online or downloaded as a PDF (4 pages). Candidates preparing for Class 11 can use Class 11 Sample Paper 2022 Economics Term 2 to understand the exam pattern, the type of questions asked, and the overall difficulty level.
Frequently Asked Questions
How can I download Class 11 Sample Paper 2022 Economics Term 2?
Open this page and click the Download button to save Class 11 Sample Paper 2022 Economics Term 2 as a PDF. It is completely free on AglaSem Docs.
Is Class 11 Sample Paper 2022 Economics Term 2 free to download?
Yes. Class 11 Sample Paper 2022 Economics Term 2 can be viewed online and downloaded as a PDF free of cost on AglaSem Docs.
How many pages does Class 11 Sample Paper 2022 Economics Term 2 have?
Class 11 Sample Paper 2022 Economics Term 2 contains 4 pages, which you can read online or download together as a single PDF.
Where can I find more Class 11 study material?
You can find more Class 11 question papers, sample papers, syllabus, and answer keys on AglaSem Docs.
Class 11 Sample Paper 2022 Economics Term 2 – Text
Read the full text of this sample paper below — useful to quickly search, copy and reference the content online without downloading the PDF.
📄 View text version (4 pages)
Page 1
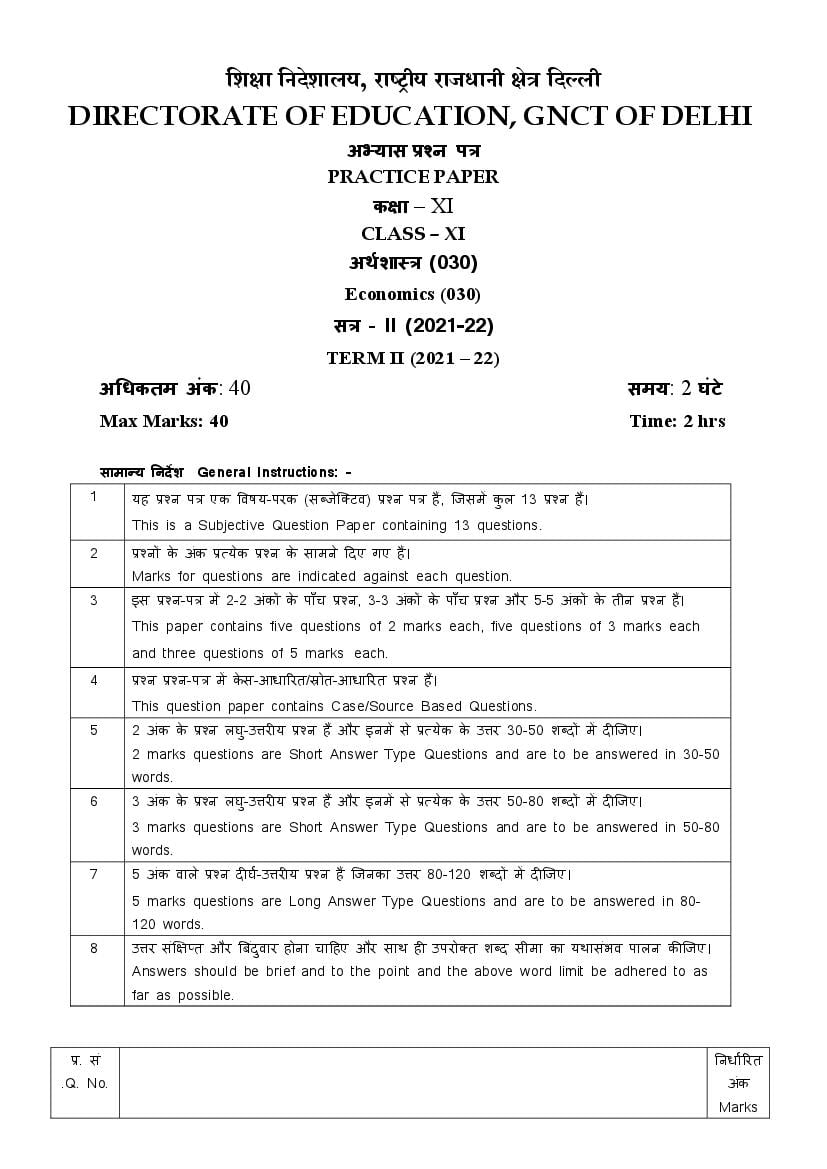
DIRECTORATE OF EDUCATION, GNCT OF DELHI
अ यास न प
PRACTICE PAPER
क ा – XI
CLASS – XI
अथशा (030)
Economics (030)
स – II (2021-22)
TERM II (2021 – 22)
अ धकतम अंक: 40 समय: 2 घंटे
Max Marks: 40 Time: 2 hrs
सामा य नदश General Instructions: -
1 यह न प एक वषय-परक (स जेि टव) न प ह, िजसम कुल 13 न ह।
This is a Subjective Question Paper containing 13 questions.
2 न के अंक येक न के सामने दए गए ह।
Marks for questions are indicated against each question.
3 इस न-प म 2-2 अंक के पाँच न, 3-3 अंक के पाँच न और 5-5 अंक के तीन न ह।
This paper contains five questions of 2 marks each, five questions of 3 marks each
and three questions of 5 marks each.
4 न न-प म केस-आधा रत/ ोत-आधा रत न ह।
This question paper contains Case/Source Based Questions.
5 2 अंक के न लघु-उ र य न ह और इनम से येक के उ र 30-50 श द म द िजए।
2 marks questions are Short Answer Type Questions and are to be answered in 30-50
words.
6 3 अंक के न लघु-उ र य न ह और इनम से येक के उ र 50-80 श द म द िजए।
3 marks questions are Short Answer Type Questions and are to be answered in 50-80
words.
7 5 अंक वाले न द घ-उ र य न ह िजनका उ र 80-120 श द म द िजए।
5 marks questions are Long Answer Type Questions and are to be answered in 80-
120 words.
8 उ र सं त और बंदव
ु ार होना चा हए और साथ ह उपरो त श द सीमा का यथासंभव पालन क िजए।
Answers should be brief and to the point and the above word limit be adhered to as
far as possible.
. सं नधा रत
.Q. No. अंक
Marks
Page 2
ू कांक क कोई दो उपयो गताएँ बताइय। 2
सूचकांक क कोई दो वशेषताएँ बताइय।
State any two uses of index numbers.
OR
State any two properties of index numbers
2. मानक वचलन को प रभा षत क िजए तथा इसका सू ल खए। 2
मानक वचलन के दो गण
ु तथा दो दोष बताइय।
Define standard deviation and write its formula.
Or
State two merits and two demerits of standard deviation.
3. धना मक और ऋणा मक सहस ब ध के दो-दो उदाहरण द िजए। 2
Give two examples each of positive and negative correlation.
4. औसत ि थर लागत को प रभा षत क िजए। AFC व के आकार क या या क िजए। 2
औसत स ाि त व का अ य(दस
ू रा) नाम या है ? य?
Define Average Fixed Cost. Explain the shape of the AFC curve.
Or
What is the other name for Average Revenue curve? Why?
5. ‘कुल उ पाद तब बढ़ता है जब सीमांत उ पाद बढ़ता है ’ - या आप सहमत ह? अपने उ र क पुि ट 2
लए कारण द िजए।
‘Total Product increases only when Marginal Product increases.’ Do you agree?
Give reasons for your answer.
6. उपभो ता क मत सूचकांक और थोक क मत सूचकांक म अंतर प ट क िजए। 3
सूचकांक के नमाण म न न ल खत सम याओं क या या क िजए।
अ) आधार वष का चयन
ब) मद का चयन
Differentiate between Consumer Price Index and Wholesale Price Index.
Or
Explain the following problems for construction of index numbers.
a) Selection of base year
b) Selection of items
Page 3
व या थय वारा ा त अंक 14 12 16 20 18 22
Calculate standard deviation for the following data:
Marks Obtained by students 14 12 16 20 18 22
नीचे द गई ता लका का अ ययन क िजए और न सं या 8 और 9 के उ र द िजए:-
पँज
ू ी क इकाइयाँ 2 2 2 2 2 2 2 2 2
म क इकाइयाँ 1 2 3 4 5 6 7 8 9
कुल उ पाद 10 24 40 50 58 64 68 68 60
Study the table below and answer questions 8 and 9 :-
units of capital 2 2 2 2 2 2 2 2 2
Units of labour 1 2 3 4 5 6 7 8 9
Total product 10 24 40 50 58 64 68 68 60
8. ऊपर द गई ता लका से उ पादन फलन के लए सीमांत उ पाद ात क िजए। 3
Find Marginal Product for the production function given above.
9. उपरो त आँकड़ से प रवतनशील अनुपात के नयम क तीन अव थाओं क पहचान क िजए। 3
Identify the three stages of the law of variable proportions from the above data.
10. एक फम का पू त व समीकरण Qs = 50 + 15P दया गया है। 2 पये त इकाई क मत पर 3
पू त क क मत लोच ात क िजए।
The supply curve of a firm is given by the equation Qs = 50 + 15P. Find price
elasticity of supply at price of Rs 2 per unit.
11. न न ल खत आँकड़ से क ण आरे ख बनाइए और प रणाम पर ट पणी क िजए। 5
X 10 20 30 40 50 60
Y 20 18 16 14 12 10
न न ल खत आँकड़ से काल पयसन के सहसंबंध गुणांक क गणना क िजए।
X 48 35 17 23 47
Y 45 20 40 25 45
Make a scatter diagram for the following data and interpret the result.
X 10 20 30 40 50 60
Y 20 18 16 14 12 10
Or
Calculate the Karl Pearson’s coefficient of correlation for the following data
Page 4
Y 45 20 40 25 45
12. खेत पर हमला करने वाले ट डय से कसान को बड़े पैमाने पर फसल का नुकसान हुआ है । इससे
बाजार म खा या न क कमी के कारण उनक क मत म व ृ ध हुई है । सरकार, अपने बफर टॉक
को यूनतम समथन मू य के साथ सावज नक वतरण णाल के मा यम से उपभो ताओं को भी दे
रह है ।
अ) यन
ू तम समथन मू य का अ य (दस
ू रा) नाम या है ? अथ यव था पर इसके भाव का 3
उ लेख क िजए।
ब) खा या न के अभाव से बाजार क मत म व ृ ध कैसे होती है ? या या क िजए। 2
Locusts attacking fields has led to massive loss of crop to farmers. This has
resulted in shortage of foodgrains in the market leading to a rise in their prices.
The government has also come to the rescue of the farmers by offering Minimum
Support Price as well as the consumers by releasing its buffer stock through Public
Distribution System.
a) What is the other name for Minimum Support Price? State its impacts on the
economy.
b) How does shortage of food grains lead to increase in market price? Explain.
3
2
13. (अ) पू त म व तार और पू त म व ृ ध के बीच अंतर प ट क िजए। 3
(ब) पूण त पध बाजार म 'फम के वतं वेश और ब हगमन क वतं ता’ क वशेषता क 2
या या क िजए।
(a) Differentiate between extension in supply and increase in supply.
(b) Explain the property of ‘free entry and exit of firms’ in a perfectly competitive 3
market? 2
Document Details
| Board / Org | Aglasem |
| Exam | Class 11 |
| Type | Sample Paper |
| Pages | 4 |
| Updated | 22 Jul 2026 |